
Chapter 2
Where are we now
Minnesota’s quality of life and economic wellbeing rely on an efficient and reliable transportation system. The system connects businesses to suppliers and customers near and far. The system also allows people to get to their jobs and schools, see a doctor and take advantage of the state’s many cultural, entertainment and recreational opportunities. Minnesota and the state’s transportation system have great strengths but there are also challenges. Table 2-1 highlights key characteristics of Minnesota.
Table 2-1: Minnesota at a glance, 2021
| Characteristic | Current Status |
|---|---|
| Population | 5,707,390 (22nd largest) |
| State Area | 86,939 square miles (12th largest) |
| Population Density | 66.6 people/square mile |
| Median Household Income | $71,306 |
| Median Household Size | 2.49 people |
| Largest City by Population | Minneapolis (429,954) |
| Largest County by Population | Hennepin (1,281,565) |
| Largest County by Area | St. Louis (6,125 square miles) |
| Gross State Product | $415 billion (19th highest) |
| Largest Industries by Gross Domestic Product |
|
| Biomes | Coniferous Forest Deciduous Forest Prairie Grassland Tallgrass Aspen Parkland |
| Lakes (10+ acres in size) | 11,842 |
Existing Transportation System
Minnesota has a vast transportation system that includes roads, railroads, airports, ports, waterways, pipelines, transit systems, trails, bikeways and walkways. The Minnesota Department of Transportation (MnDOT) and local, regional, state, Tribal and federal government, along with private and non-profit partners keep the system running. Table 2-2 highlights key characteristics of the transportation system in Minnesota. The following sections provide more detail on the background, use and performance of each part of the system.
Minnesota’s quality of life and economic well-being rely on an efficient and reliable transportation system.
Table 2-2: Snapshot of Minnesota's transportation system, 2022
| Characteristic | Current Status |
|---|---|
| All streets, roads and highways | 142,865 centerline miles |
| State highways | 11,703 centerline miles |
| County roads | 44,526 centerline miles |
| City streets | 23,149 centerline miles |
| Township roads | 55,548 centerline miles |
| Other public roads | 7,939 centerline miles |
| Bridges (10 feet span and greater) | 21,148 |
| Sidewalk miles | 698 miles along state highways plus thousands more along local roadways |
| Designated U.S. Bicycle Routes | North Star Route (USBR 41): 315 miles Mississippi River Trail (USBR 45): 817 miles Prairie Lakes Bicycle Route (USBR 20): 188 miles Total: 1,320 miles |
| Off-highway Vehicle Trails | 2,959 miles |
| Twin Cities Transit (seven county area) | 204 bus routes, two light rail transit lines, four bus rapid transit lines and dial-a-ride services |
| Greater Minnesota Transit | 40 public transit systems, 28 are rural systems, 7 small urban systems and 5 systems operated by tribal nations |
| Intercity Passenger Rail | Amtrak Empire Builder (Chicago and the Pacific Northwest) |
| Intercity Bus | Greyhound, Jefferson Lines, Land to Air Express, Megabus, Northfield Lines, Rainbow Rider and Saint Cloud NorthStar Link |
| Freight Rail | 4,444 route miles serviced by 21 railroad companies |
| Commuter Rail | Northstar commuter rail line (Minneapolis to Big Lake) |
| Airports | 305 airports, 133 public airports with nine commercial airports |
| Great Lakes Ports | Three ports on Lake Superior |
| River Ports | Four ports on 195 miles of the Mississippi River System |
| Pipelines | 10,398 miles |
| Carsharing | Two services (HOURCAR — which operates the electric car service Evie — and Zipcar) operating in Minneapolis, St. Paul, Winona and Mankato |
| Ride-hailing | Local taxi companies along with Lyft and Uber |
| Scooter Sharing | Services like Bird, Lyft and Lime primarily operate in the Twin Cities area and are becoming more prevalent in Greater Minnesota. |
| Bicycle Sharing | Nice Ride operates in Minneapolis and on the University of Minnesota campus; additional informal systems in communities statewide |
Streets, Roads & Highways
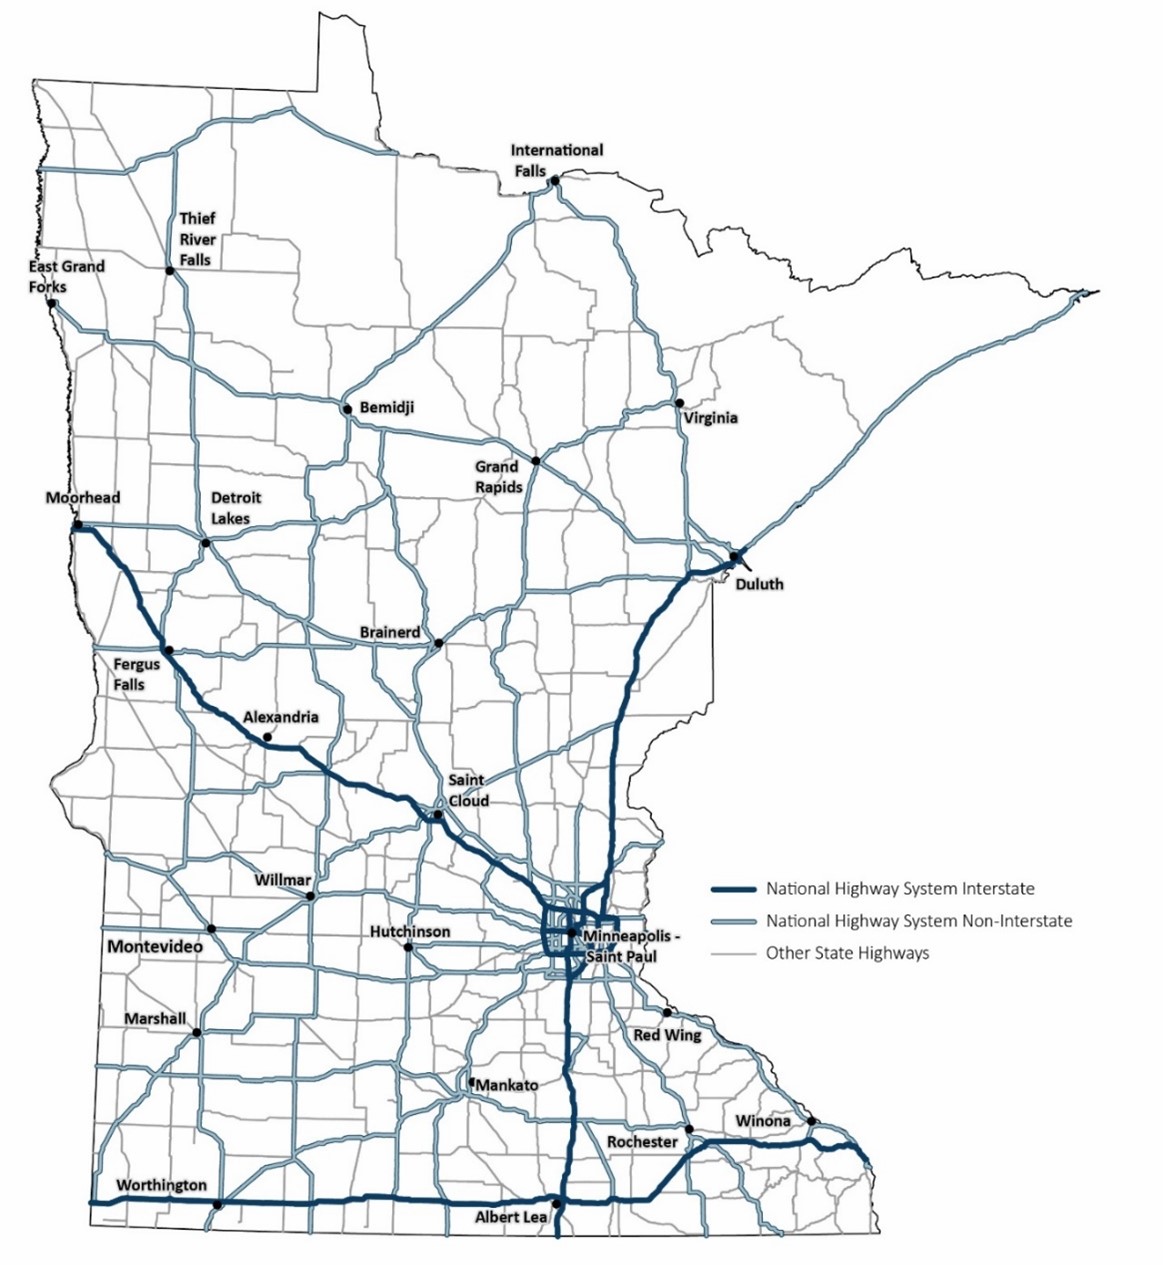
Minnesota has the fourth largest system of streets, roads and highways in the country. As a whole, the network is made up of 142,8651 centerline2 miles of public roadways across state, county, city and township systems. For context, the state ranks 22nd in population and 12th in geographic size. Figure 2-1 shows the existing state highway network. This network of Interstate, US and state highways is the backbone of Minnesota’s roadway system. It includes routes designated as part of the National Highway System (NHS) and other state roads. The state highway network is approximately 8% of all roadways in Minnesota.
Figure 2-1: Minnesota's State Highway network, 2022
VEHICLE MILES TRAVELED
Minnesota’s roadway network has changed over time to meet the needs of those who use it. From 1992 to 2018, VMT growth from motorized vehicles on all roads in Minnesota averaged about 1.4% per year.3 From 2000 to 2019, overall statewide total VMT rose approximately 16.5%, from 52.1 billion VMT to 60.7 billion VMT.4 However, statewide VMT saw a reduction by 1% from 2018 to 2019 per capita. Due to the COVID-19 pandemic, 2020 saw an unprecedented drop in VMT throughout the state. In the early months of the pandemic, the volume of vehicles on Minnesota roadways dropped in some areas by 30% to 50%. This drop in VMT is shown in Figure 2-2.5
Figure 2-2: Total vehicle miles traveled in Minnesota, 2000-2021
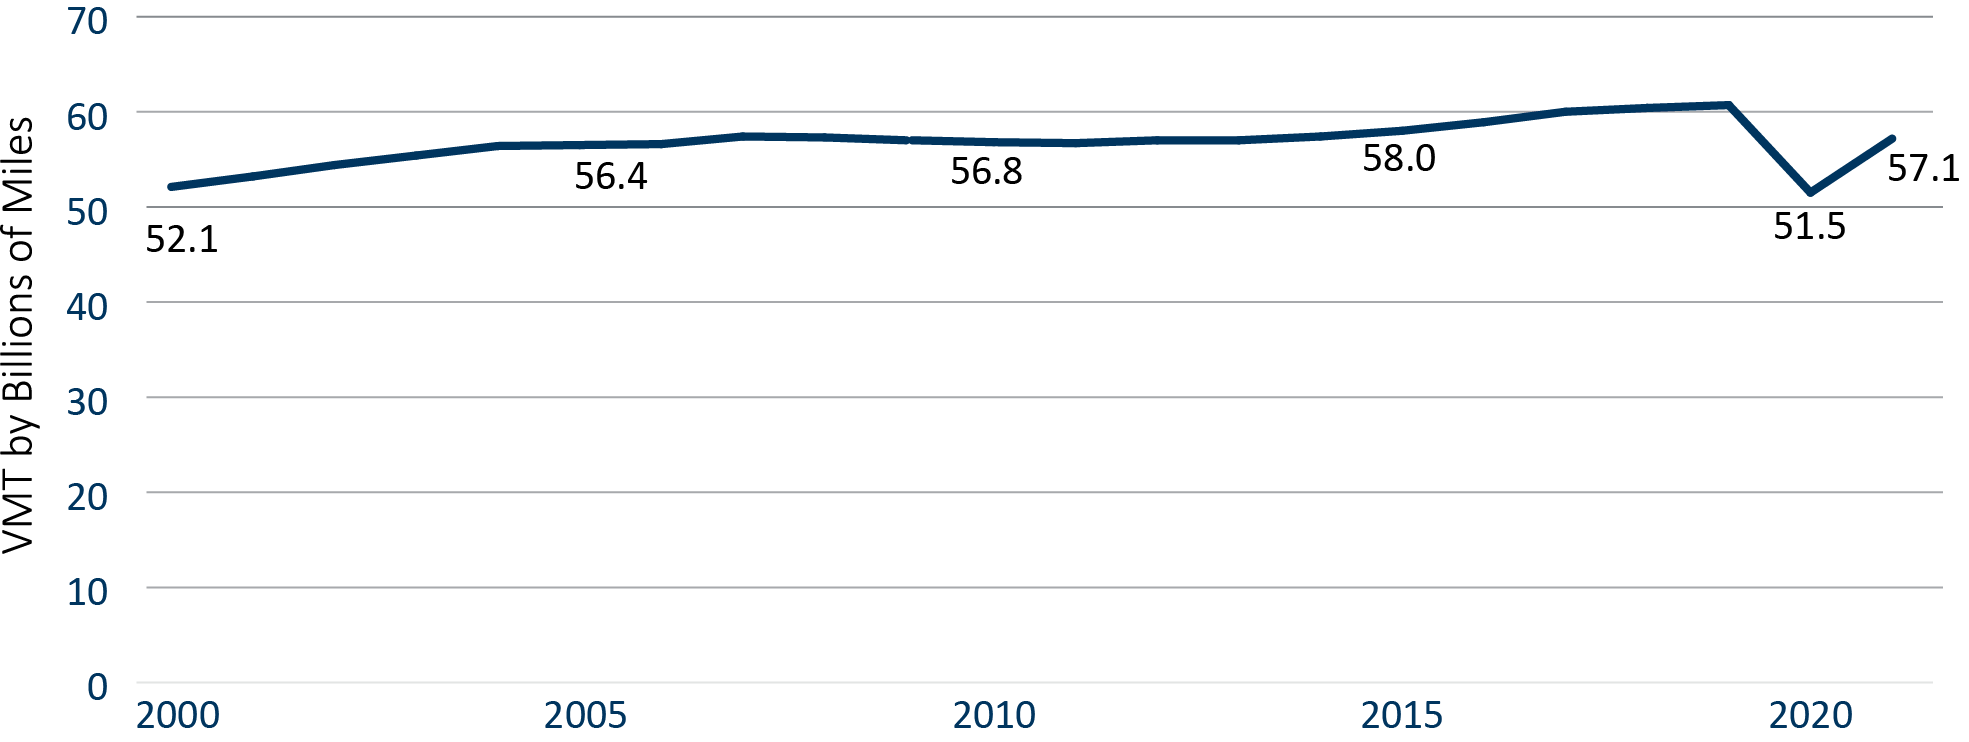
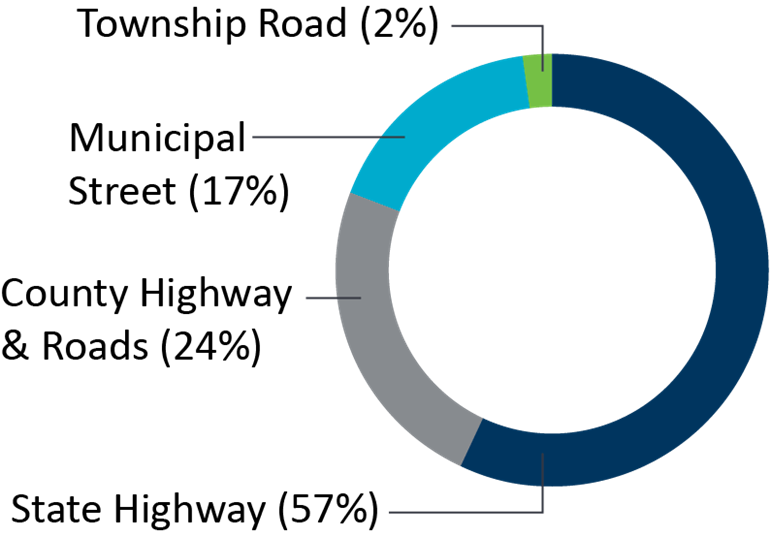
Figure 2-3 shows how VMT is distributed across the different roadway systems in Minnesota. Since 2020, traffic volumes have returned to or exceed pre-pandemic levels in most of the state. Recent evidence from traffic volume data in the Twin Cities6 suggests that while daily volumes are rebounding to near pre-pandemic levels, the distribution of trips throughout the day has differed significantly.7 Volumes during the traditional morning peak period are lower, consistent with many workers continuing to work remotely, while trips during the afternoon peak period are returning to higher levels. In the near term, VMT is predicted to remain relatively consistent, but could rise considerably if Minnesotans don’t use lower emission travel options like walking, rolling, bicycling and taking transit or bundle trips to destinations
Figure 2-3: Percentage of vehicle miles traveled by roadway system, 2020
PAVEMENT CONDITION
Faced with an aging system and increasing construction costs, transportation partners throughout Minnesota are struggling to keep the roadway system in good condition. Even with these challenges, there has been a decrease in state highway miles rated as poor condition while more of the system is rated in fair and good condition, as seen in Figure 2-4.
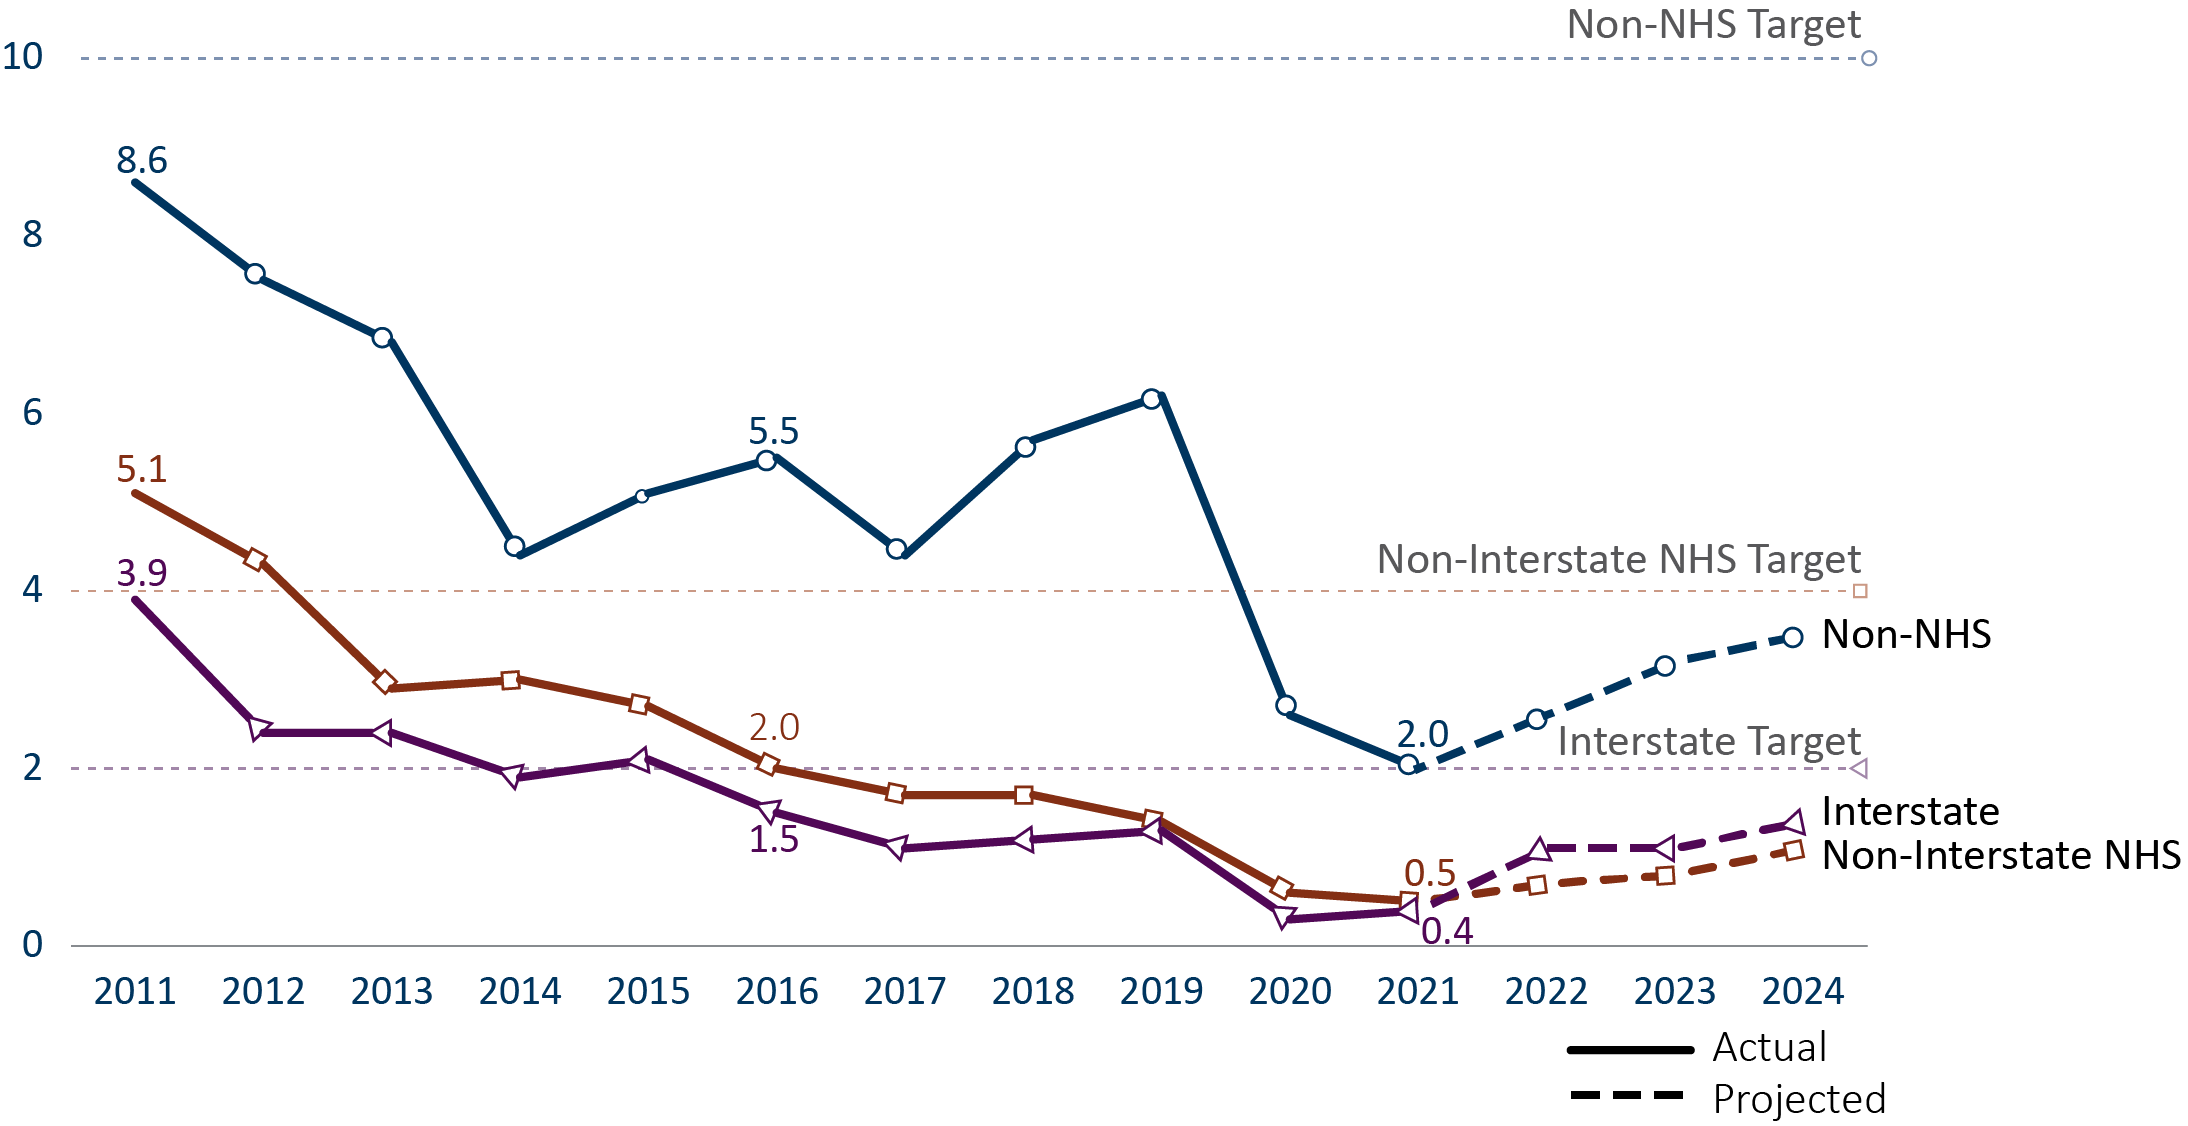
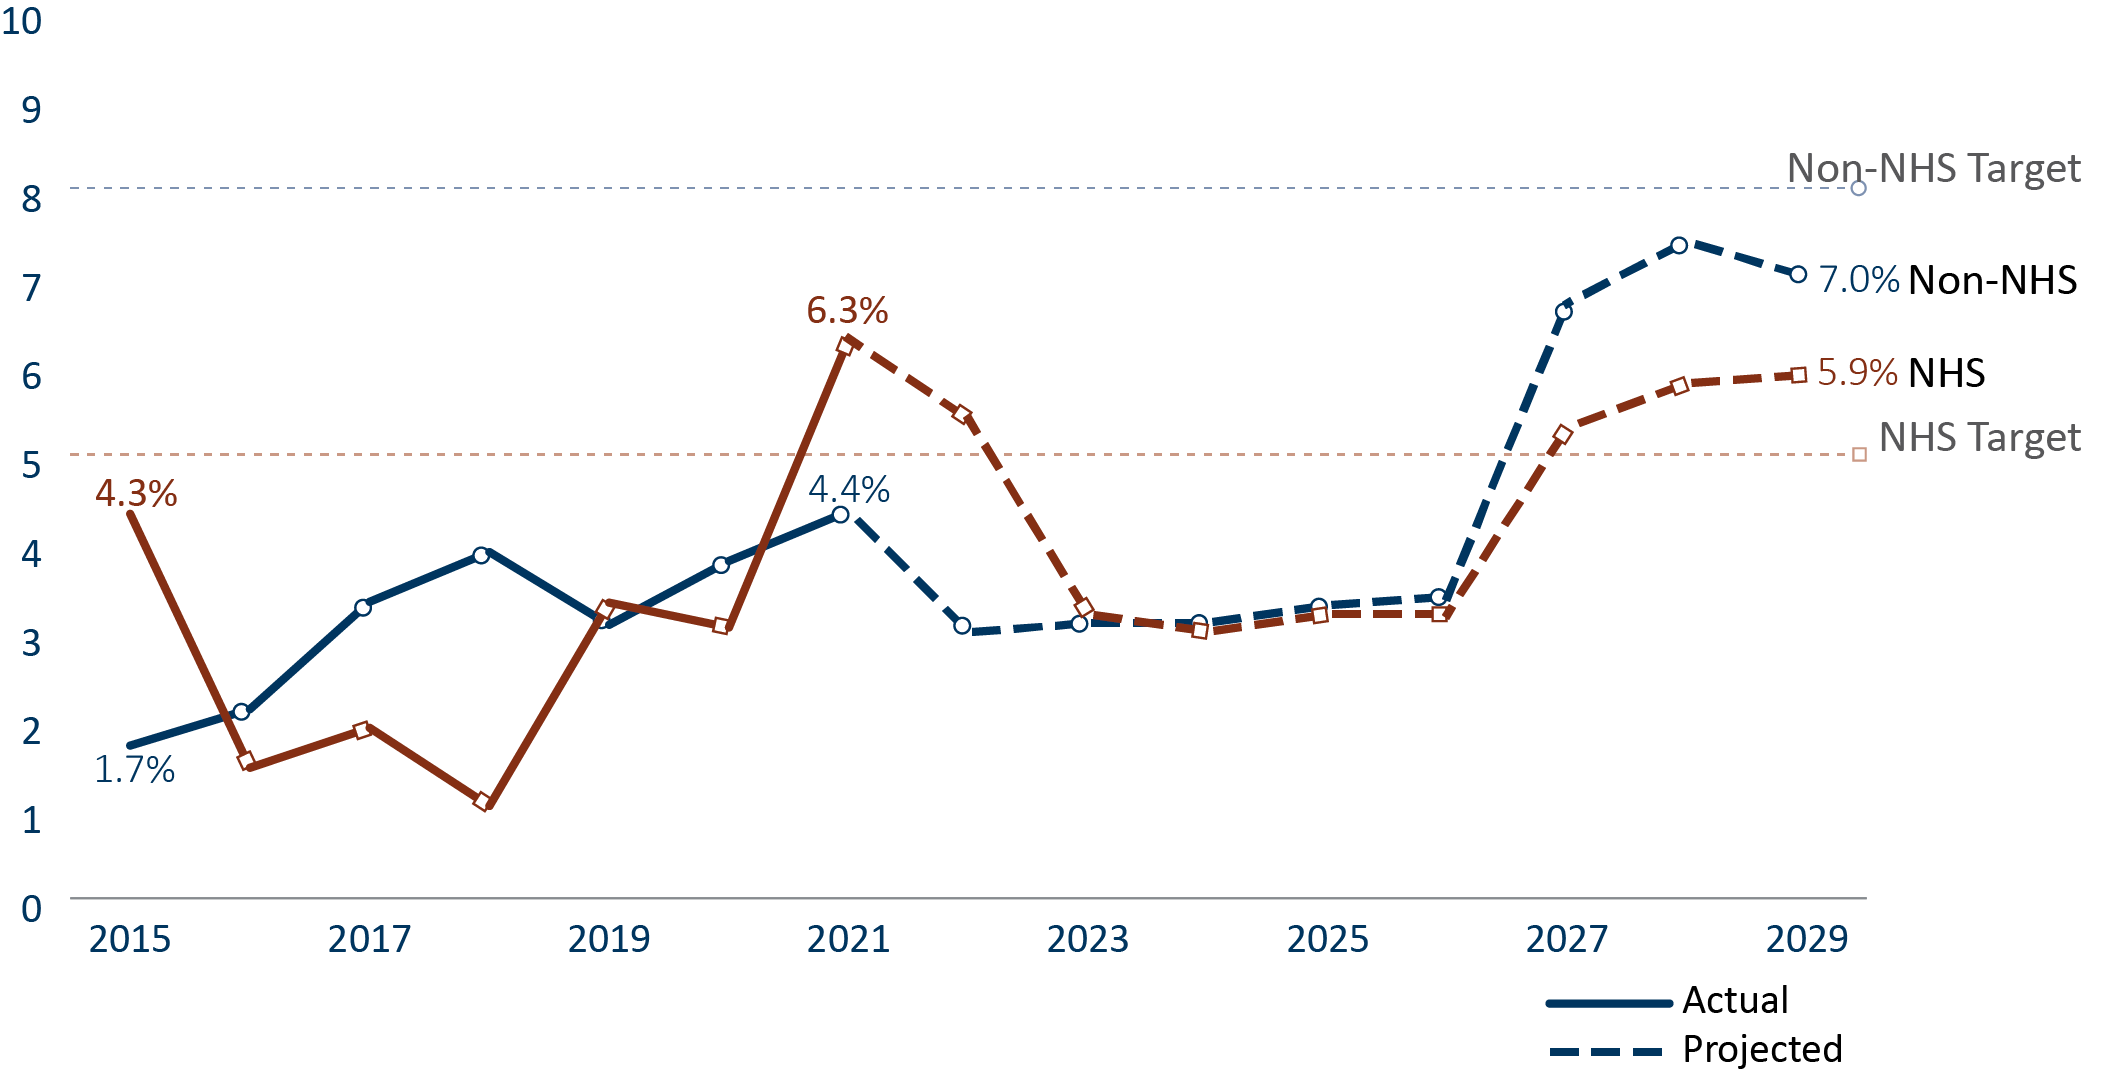
In 2021, the Interstate system met the state target of less than 2% of Interstate pavements in poor condition. Additionally, the Non-Interstate NHS roadways achieved the target of having less than 4% of pavement in poor condition with 0.5% in poor condition in 2021. Finally, the Non-NHS system in 2021 also achieved the target of less than 8% in poor condition.
Although the roadways rated in poor8 condition are going down, the percentage of roadways rated in good condition are not increasing at the same rate. This means that more roadways are being categorized as in fair condition. If more roadways aren’t moved from fair condition to good condition, the percentage of pavements in poor condition across all roadways is expected to increase in the future. Figure 2-4 shows the percent of roadway miles with a Ride Quality Index less than 2.0 since 2011 and projections for 2022-2024.
Figure 2-4: Percent of Minnesota State Highway pavement in poor condition, 2021
BRIDGE CONDITION
MnDOT is currently not meeting the state’s target for the acceptable percentage of NHS bridges in poor condition.9 As of 2021, 6% of NHS bridges were in poor condition, which does not meet the NHS state target. Over 4% of Non-NHS bridges were in poor condition, which does meet the Non-NHS state target. Thirty percent of NHS bridges and 31% of Non-NHS bridges were in good condition.10 As seen in Figure 2-5, the percentage of bridges on the NHS in poor condition exceeded the NHS target of 5% in 2021. This is projected to still exceed the target in 2022 before returning to below the target in 2023. However, the percent of bridges on the NHS in poor condition is projected to again rise above the target in 2026. Note these projections are anticipated to improve as MnDOT expects to use federal funding for bridges as authorized by the Infrastructure Investment and Jobs Act.
On the local road network, the percentage of bridges in poor condition was 5% and 66% of bridges were in good condition in 2020.11
Figure 2-5: Percent of Minnesota State Highway bridges in poor condition, 2021
TRANSPORTATION SAFETY
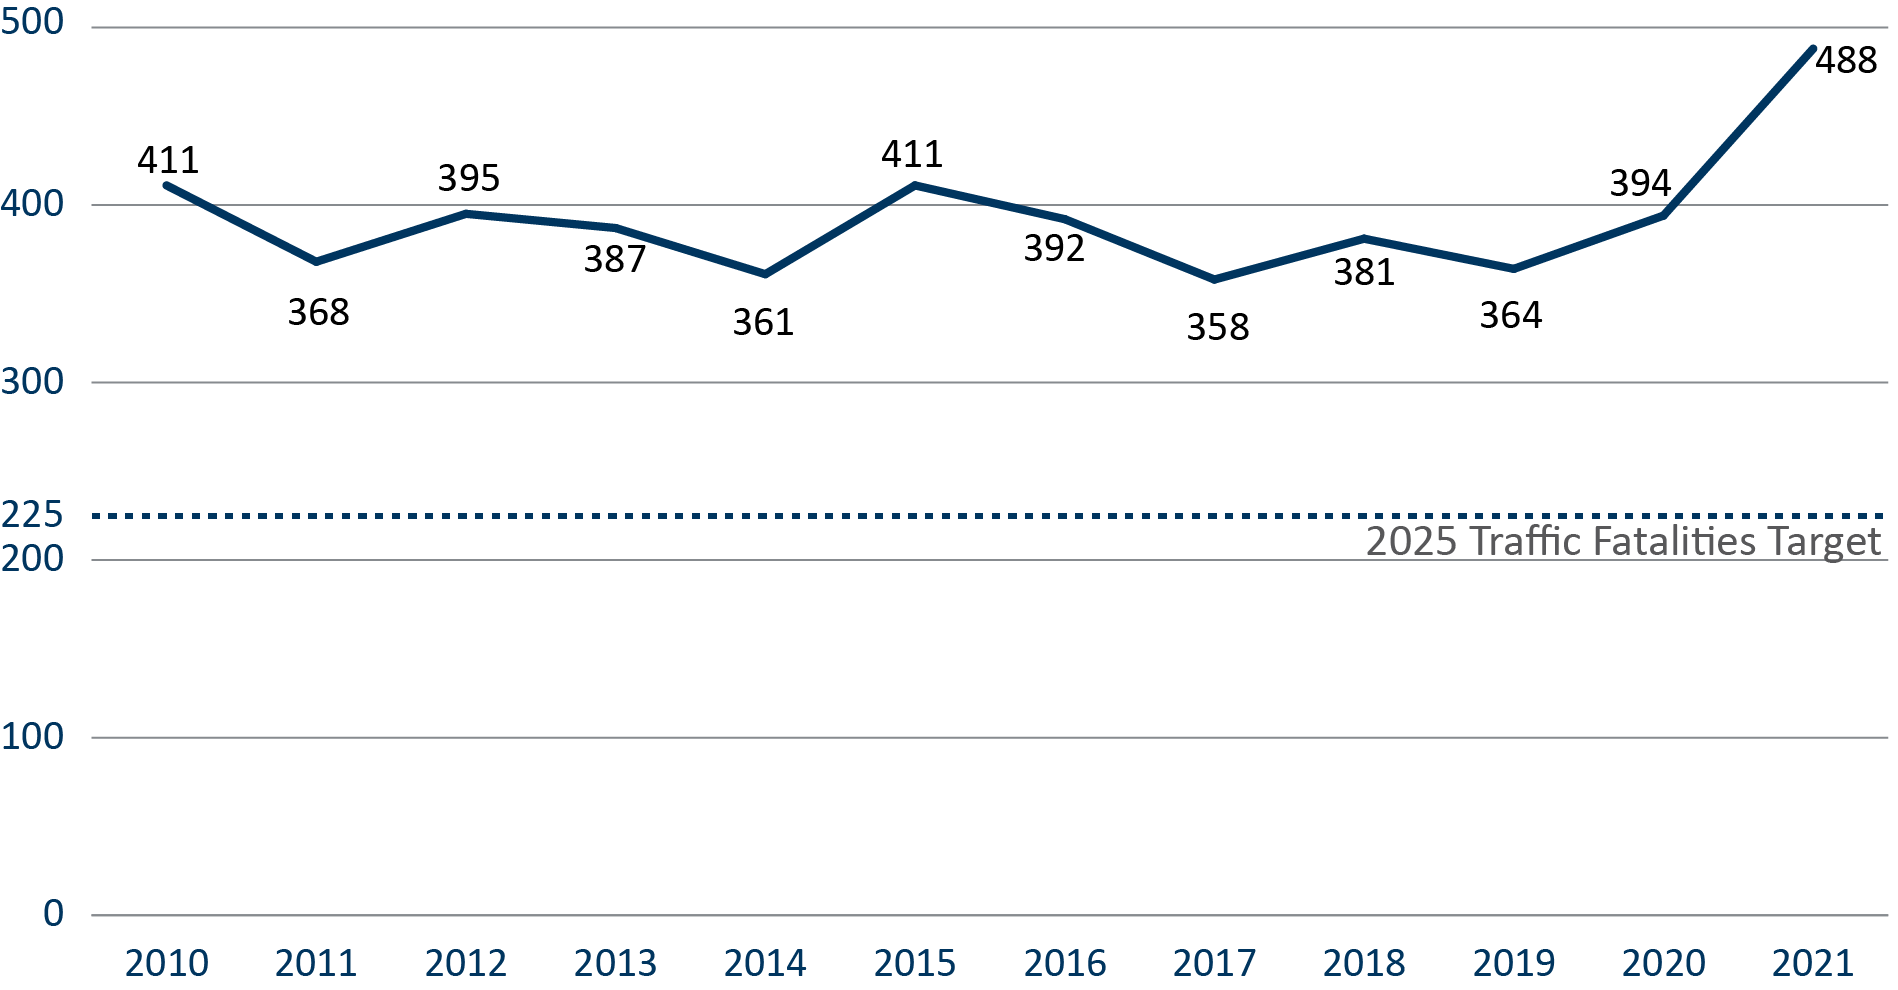
2021 was the deadliest year on Minnesota’s roads in over a decade. In total, preliminary reports from the Minnesota Department of Public Safety state that in 2021, 488 people died due to motor vehicle crashes compared with 394 fatalities in 2020, a 24% increase (Figure 2-6). Note that 2021 numbers are preliminary and are subject to change. The number of serious injuries on the roadway system increased from 1,569 in 2020 to 1,722 in 2021. Overall, the total number of serious injuries has generally trended down over the past six years.12
From 2016 to 2020, approximately 48 pedestrians and eight bicyclists were killed each year.13 Fatalities and serious injuries involving bicyclists and pedestrians remain largely unchanged. For example, in 2015 there were 41 pedestrian and 10 bicyclist fatalities compared with 55 pedestrian and 9 bicyclist fatalities according to preliminary 2021 crash data.
Figure 2-6: Traffic fatalities on Minnesota roads, 2010 to 2021
MANAGED LANES
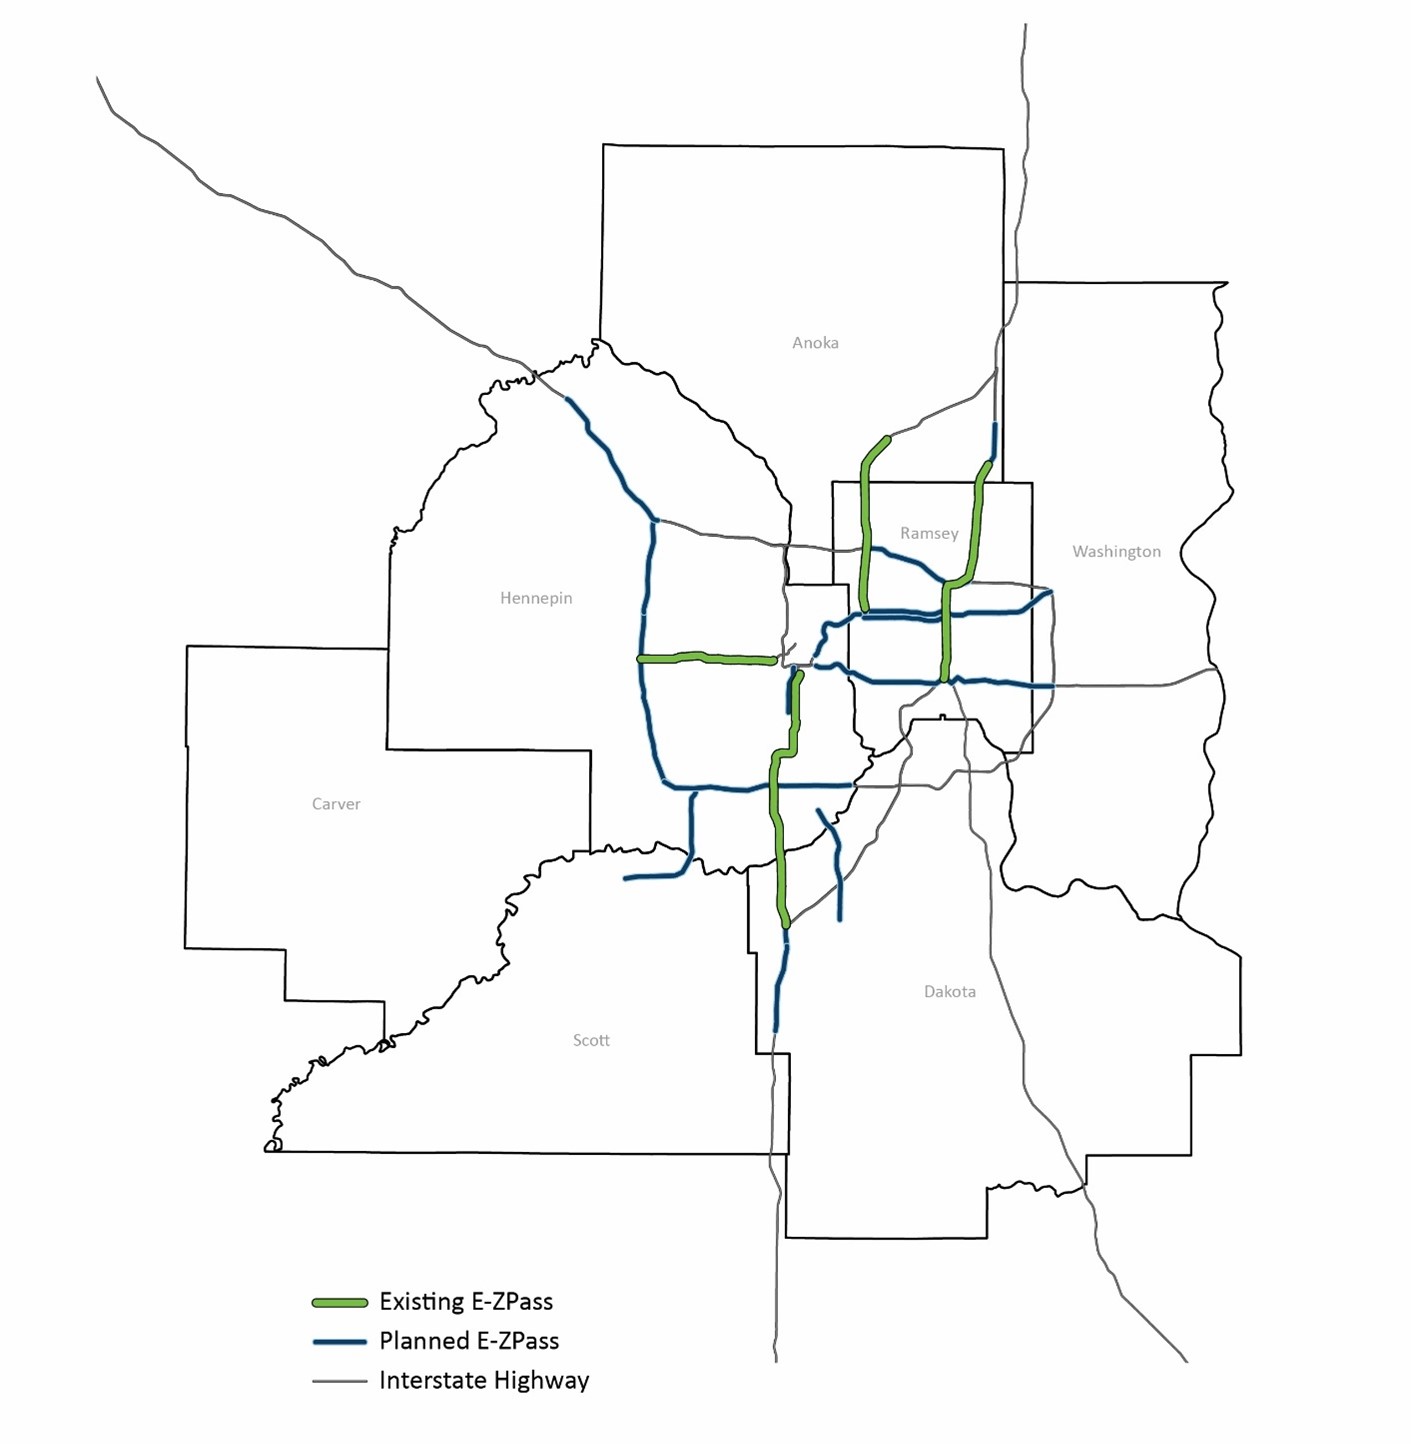
“Managed lanes” are express lanes that use electronic tolls to improve traffic flow, provide alternatives to congestion and improve safety. Managed lanes were first implemented on the Twin Cities’ metro area freeway system in 2005 along I-394. Automated toll lanes and other managed lane technologies have since been extended to portions of I-35W and I-35E. These technologies are under consideration for other parts of the metro area. Figure 2-7 shows the existing and planned managed lane corridors in the metro area. Metro area managed lanes are also referred to as E-ZPass and were previously known as MnPASS.
Figure 2-7: Existing and Tier 1 planned managed lane corridors, 2022
HIGHWAY RELIABILITY & CONGESTION
There are many ways to think about and assess slowdowns on the roadway system. These include measures that analyze traffic delays, travel reliability and traffic congestion when monitoring the performance of the transportation network. Travel time reliability is important for the public and freight operators. For individual travelers, reliability may dictate what mode or travel route to use, or it may impact departure times. For freight operators who have to make a freight transfer, an unexpected delay may lead to missed connections or longer travel times.
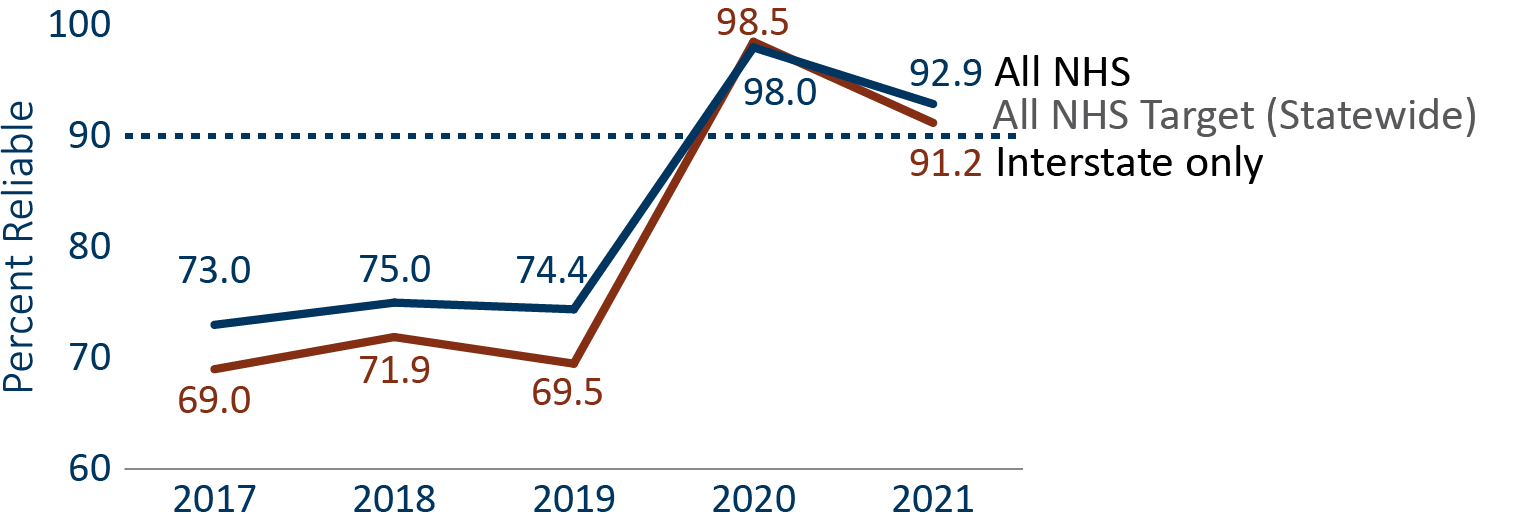
Since 2013, the reliability of Minnesota’s Interstate system has remained relatively consistent at both the statewide and Twin Cities area levels (see Figure 2-8 and Figure 2-9). The statewide Interstate reliability measures tend to be higher (more reliable) than the metro measures since the metro area tends to experience higher traffic volumes and congestion levels. For most of the years between 2017-2020, the Interstate has been less reliable compared to NHS for both the statewide and Twin Cities areas. Due to the COVID-19 pandemic, reliability was considerably better since fewer people were traveling and there was rarely congestion.
Figure 2-8: Statewide travel reliability, 2017-2021
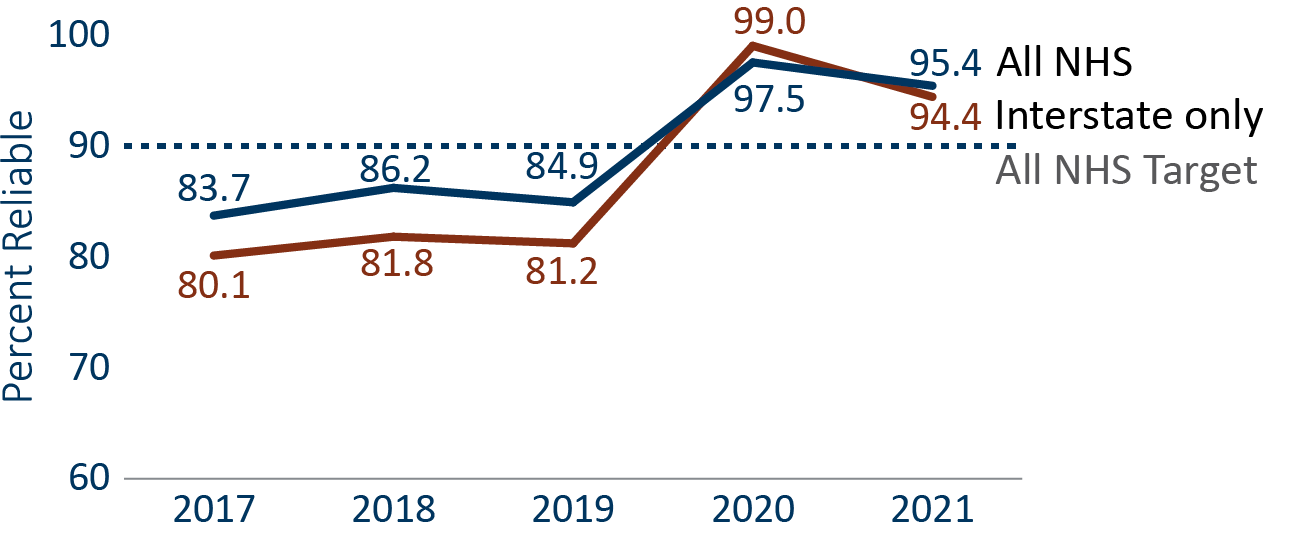
Figure 2-9: Twin Cities travel reliability, 2017-2021
Both delays and congestion can be measured in the amount of time and fuel wasted, cost to travelers or reductions in access to destinations within a given amount of time. MnDOT keeps detailed data on motor vehicle congestion for the Twin Cities and collects and analyzes travel time reliability data for Greater Minnesota. Currently, MnDOT measures motor vehicle congestion in the metro area based on travel speed during peak periods which can be seen in Figure 2-10.
Figure 2-10: Percentage of freeway miles in the Twin Cities operating below 45 mph during peak periods, 2010 TO 2021
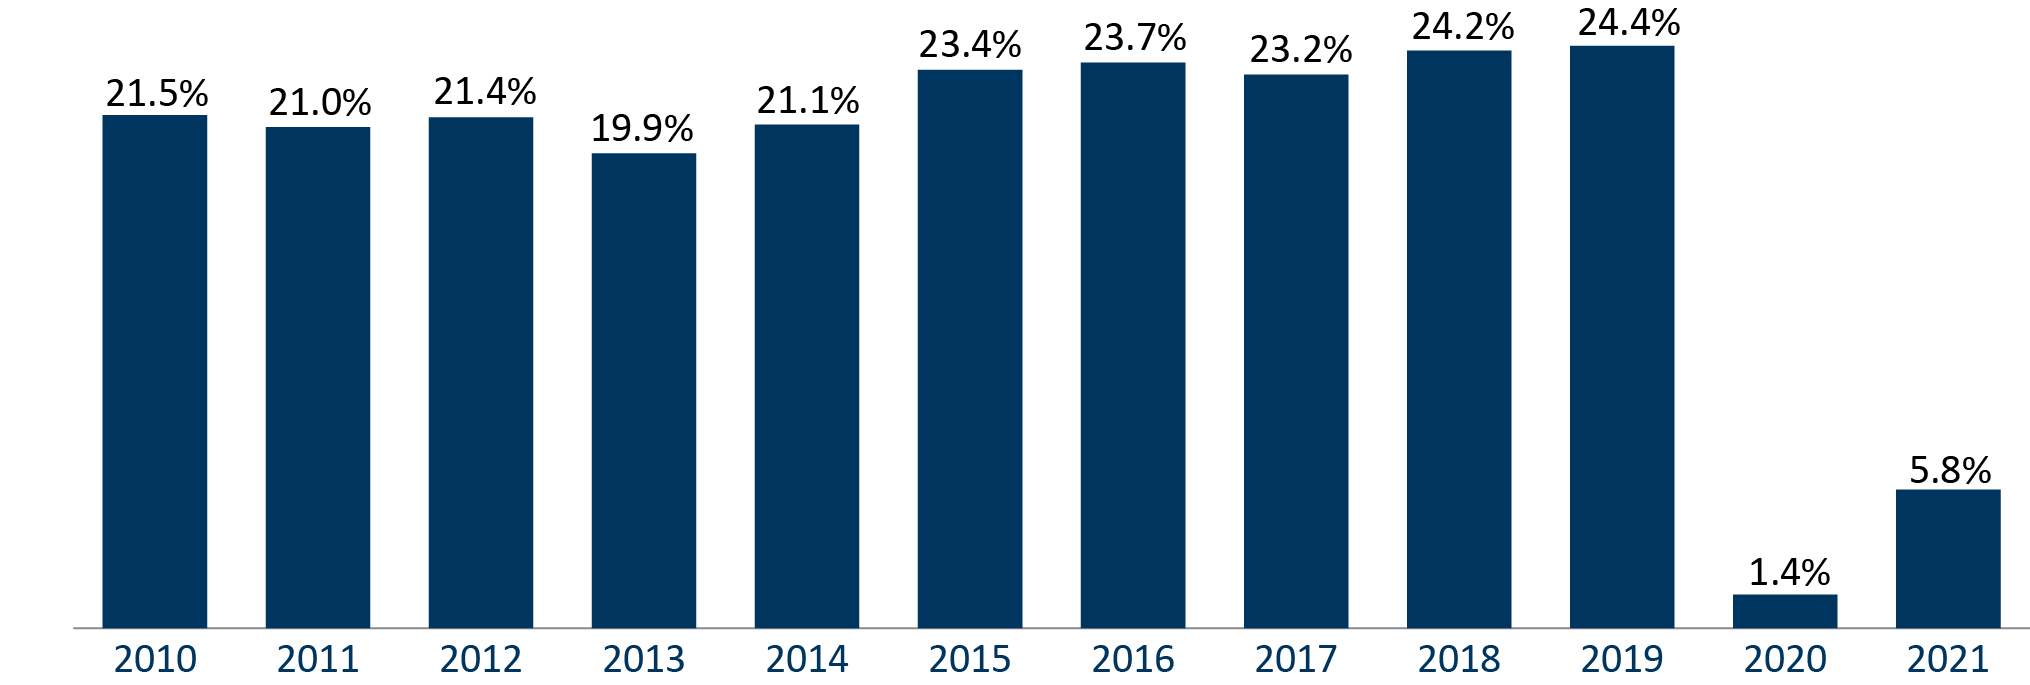
MnDOT defines freeway congestion as traffic flowing at speeds less than or equal to 45 miles per hour. Freeway congestion levels in the metro area have remained relatively constant since 2010, with a little more than 20-25% of freeway miles congested during peak travel periods. The metro area freeway system had a marginal increase in the percentage of miles of freeway congested, from 24.2% in 2018 to 24.4% in 2019. The COVID-19 pandemic stay-at-home order decreased congestion by 30-50% initially and it remains at a 15-20% decrease. In 2020, only 1.4% of freeways miles were operating below 45 miles per hour during peak periods. In 2021, congestion increased slightly to 5.8% of freeway miles operating below 45 miles per hour in peak periods. Although, congestion is currently projected to increase in the coming years.
“…I usually need to get to work at a specific time each day and just from a logistical standpoint I cannot really afford to introduce any variables into my morning commute.” - Policy Panel and Online Discussion Board Participant
Bicycling & Walking
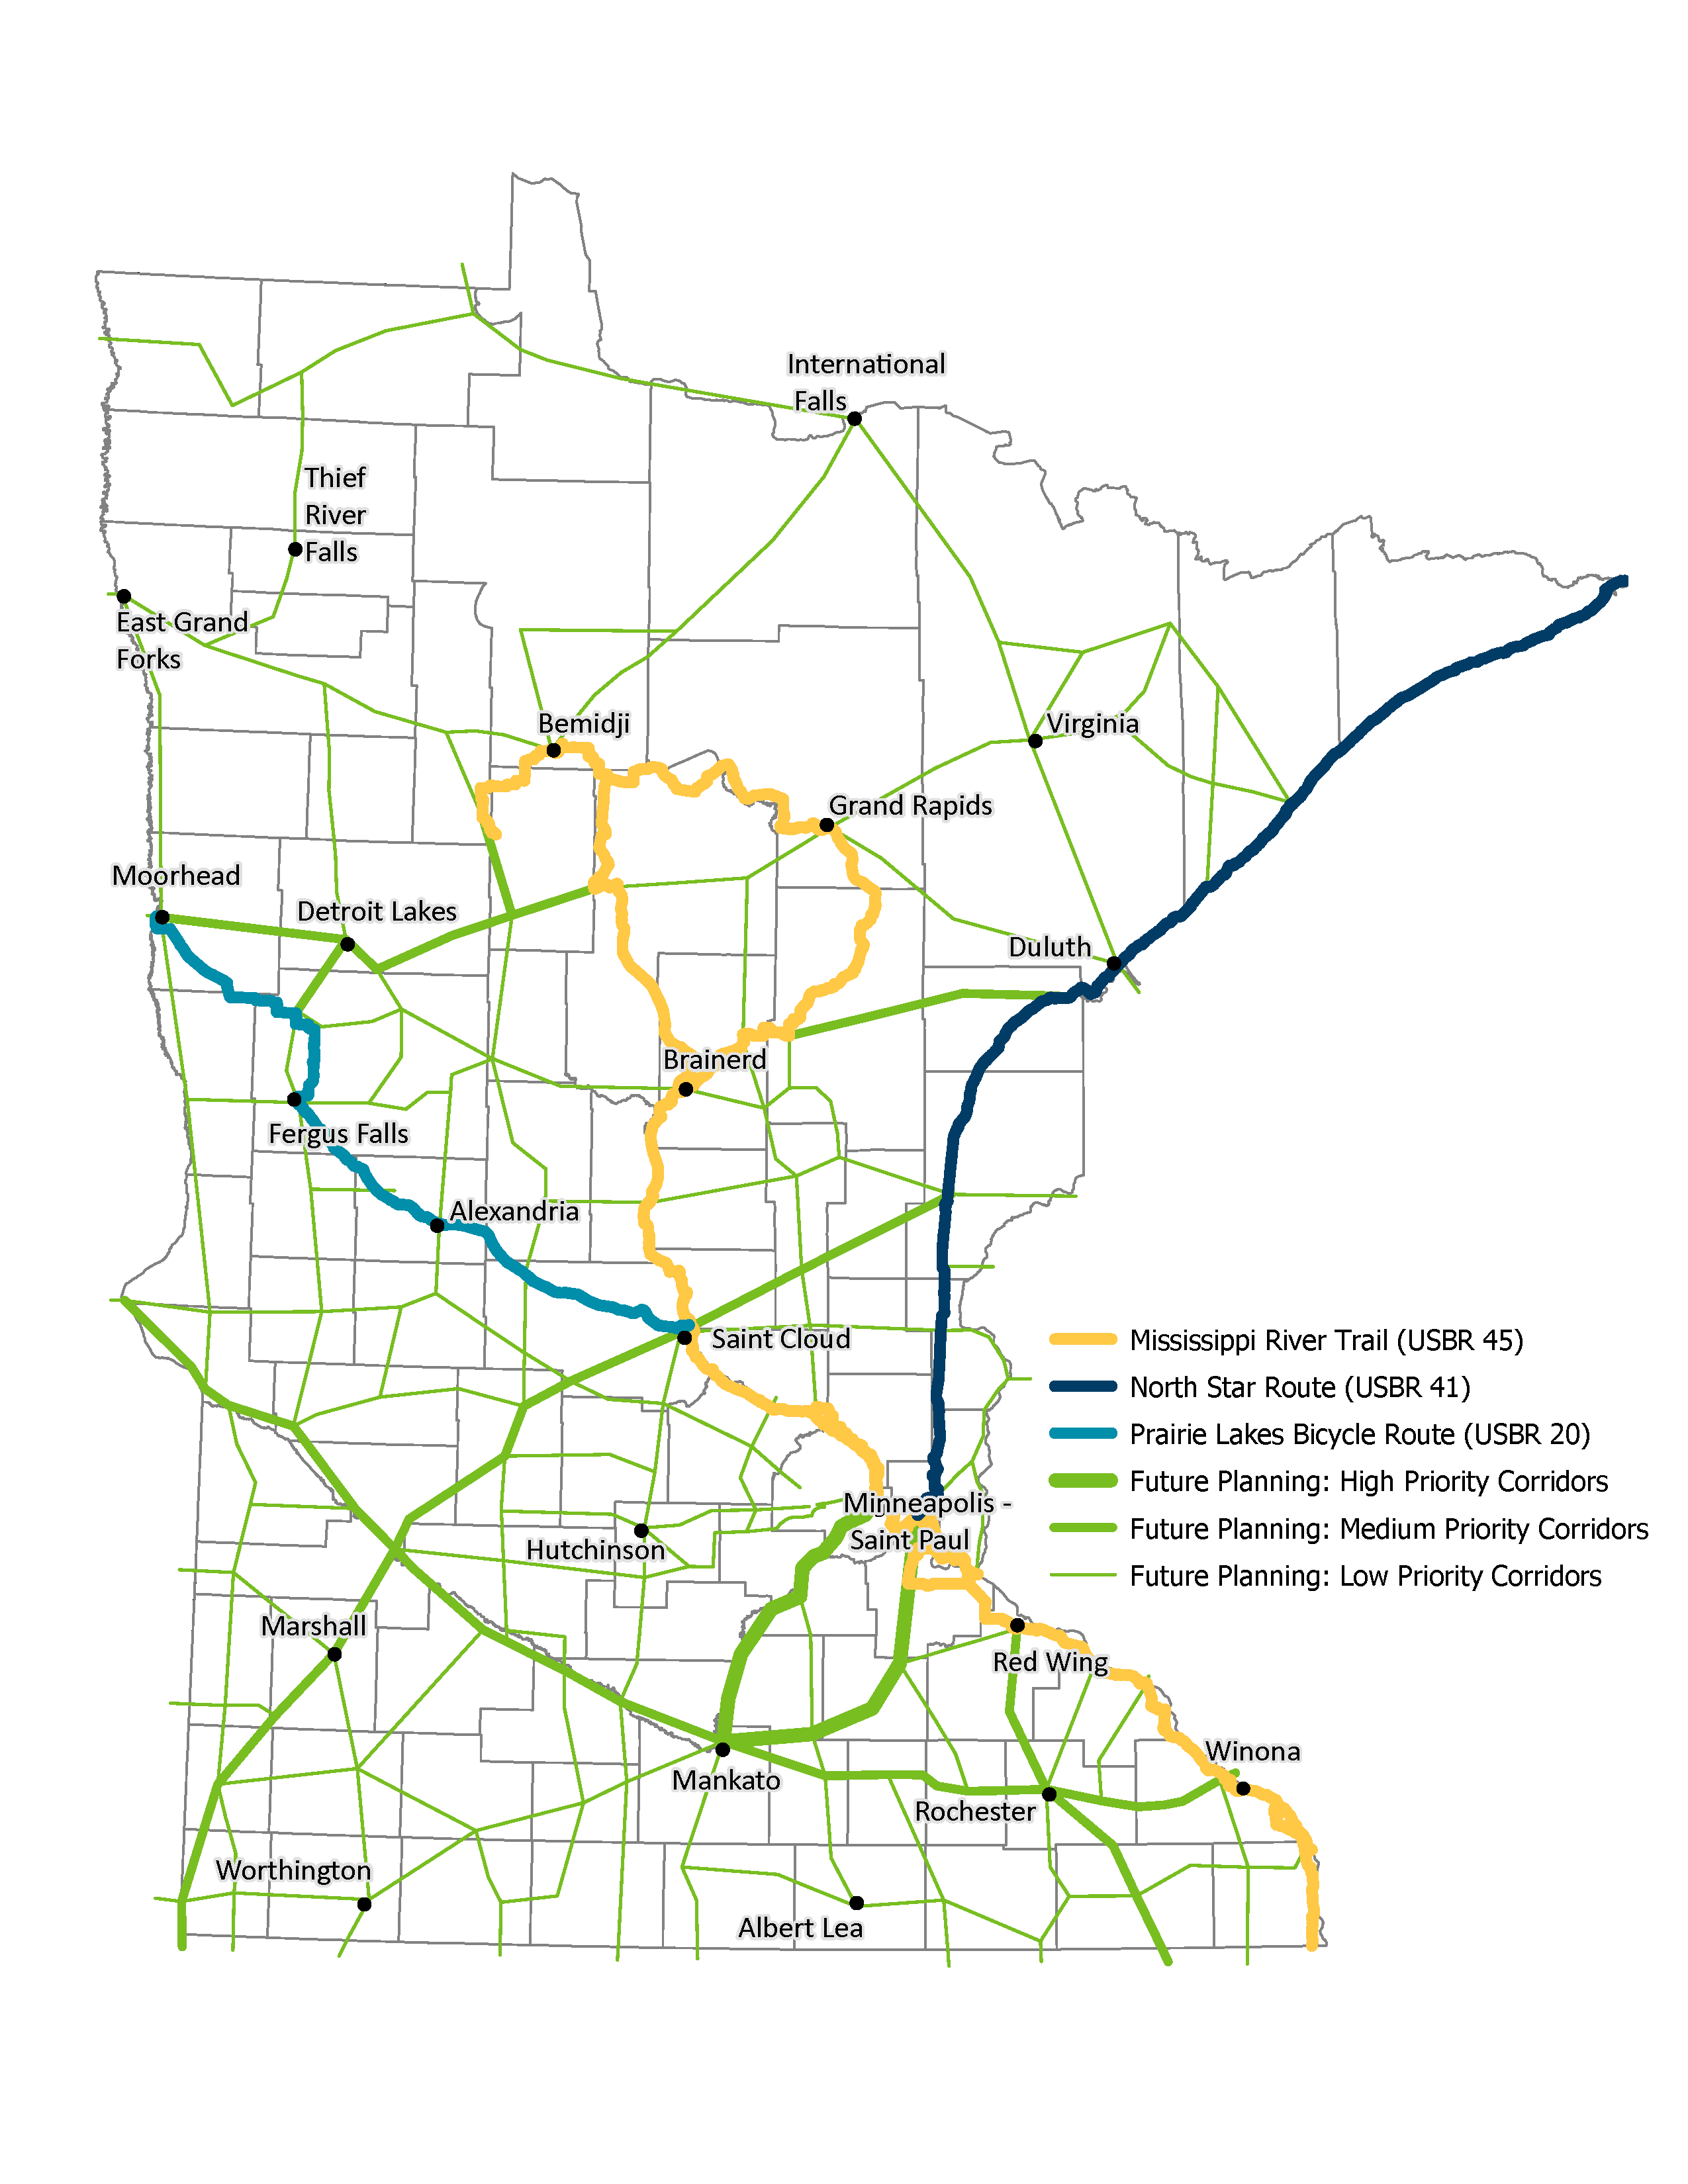
For bicycling and walking, local trips within communities are often more important than long-distance connections. However, there is limited data to report at a local level. At the state level, Minnesota currently has three designated U.S. Bicycle Routes – the Mississippi River Trail, the North Star Route and the Prairie Lakes Bicycle Route. These routes include 1,320 miles of designated bicycle facilities on state and local roads and trails.
Additionally, there are more than 4,000 miles of trails for bicycling and walking in the state. Figure 2-11 highlights existing state trails and priority bicycle corridors under consideration for infrastructure improvements and future designation as state bicycle routes. There are also many more off-road infrastructure facilities that support bicycling and walking. Examples of on-road bicycle and pedestrian facilities include bicycle lanes and widened or paved shoulders.
Minnesota’s statewide bicycling and walking trends can be seen in the results of MnDOT’s Omnibus Survey, where respondents are asked which transportation modes they used over the past year. MnDOT’s Omnibus Survey is a biennial public opinion survey that provides department leadership, managers and program staff with public feedback on MnDOT’s core operations. The 2017 Omnibus Survey indicated 28% of respondents either walked or used a wheelchair or mobility device at least a few times per week, while 9% said they bicycle at least a few times per week. In 2019, 31% of respondents indicated they either walked or used a wheelchair or mobility device at least a few times per week, while 8% said they bicycle at least a few times per week. During 2020, COVID-19 had a substantial impact on frequency of bicycling and walking trends statewide. Twenty percent of survey respondents indicated they walked or used a wheelchair more due to COVID-19 and 13% of survey respondents indicated they bicycled more due to COVID-19.14
In the Twin Cities, 17% of Minnesotans use a bicycle for travel at least once a month and over 7% complete their trips with a bicycle at least once a week. Almost 2% of daily commutes in the Twin Cities are completed on foot or through rolling.15 The COVID-19 pandemic also had an impact on daily walking and bicycling trends in the Twin Cities. The initial five weeks of the pandemic saw an increase of 51% in people walking and bicycling when comparing 2017 to 2019 at the same time.
Figure 2-11: Minnesota's designated state routes and priority future bicycle corridors, 2022
Public Transit
SEVEN-COUNTY METRO AREA TRANSIT
A variety of public transit options are available in the seven-county metro area. Current options include regular and express bus routes, light rail transit, commuter rail and bus rapid transit—these are collectively known as fixed route services. Dial-a-ride service is also available throughout the region. All 188 communities in the Twin Cities have access to some form of public transit service. Transit use has remained steady between 2010 and 2019 according to Metropolitan Council’s Travel Behavior Inventory Household Survey results. Of those who use transit, 7% use transit weekly and 44% only use transit when attending an event.16
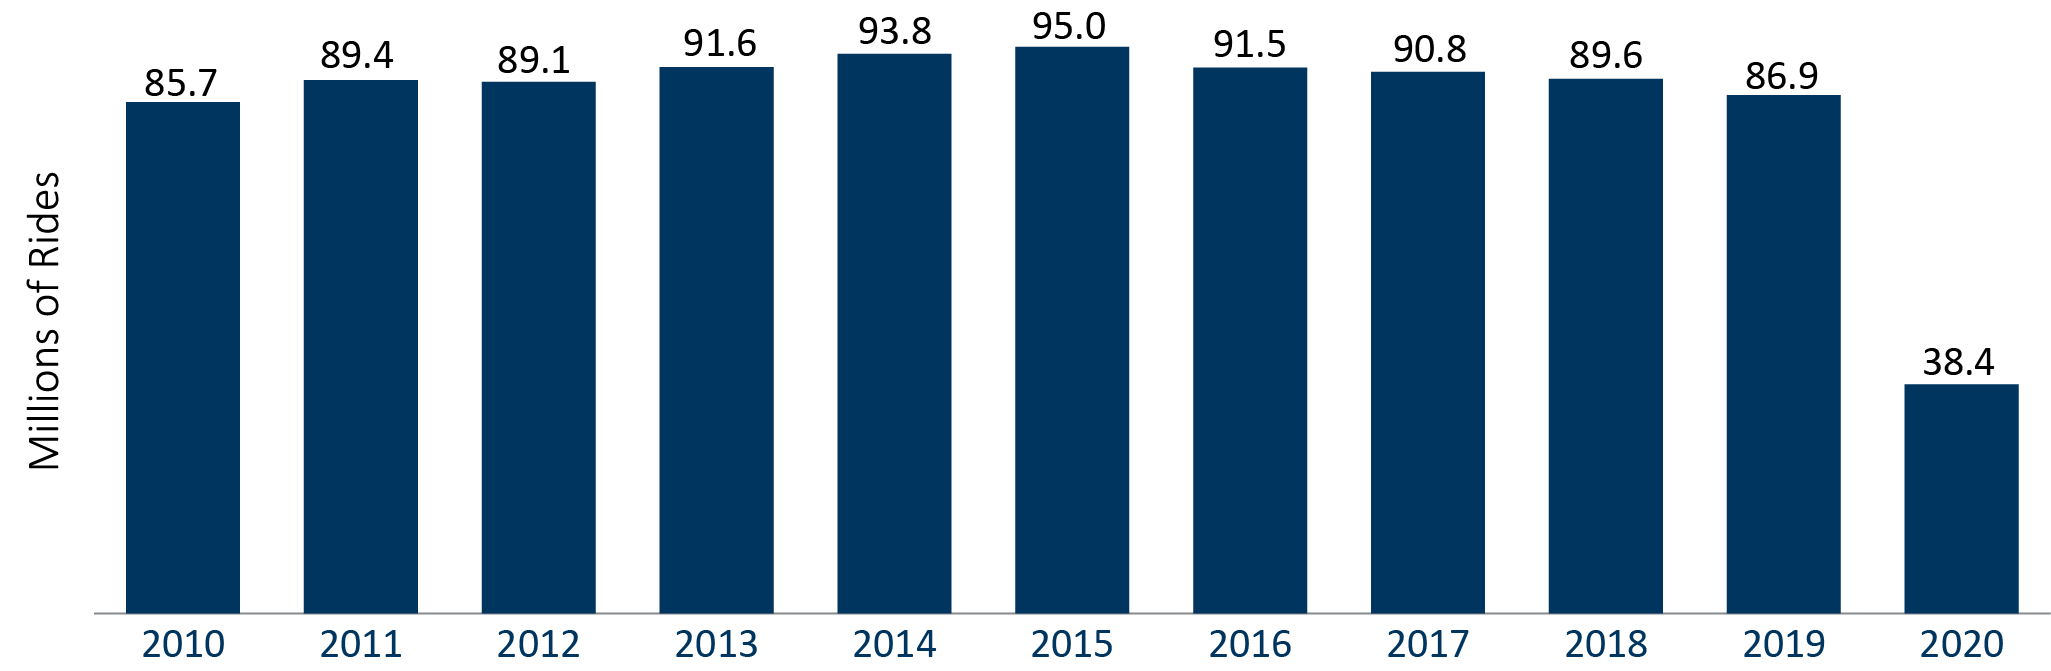
COVID-19 had a significant impact on transit ridership and service. Ridership fell on all transit services – by as much as 60% on local bus routes, 70% on light rail and 95% on express bus routes and commuter rail.17 Twin Cities transit ridership fell from a total of 82,486,307 rides in 2019 to 38,390,500 in 2020.18 In 2021, ridership fell another 6.5% to a total of 35,885,429. 19 Figure 2-12 shows total transit ridership between 2010 and 2020.
Figure 2-12: Seven-County regional transit ridership, 2010 to 2020
GREATER MINNESOTA TRANSIT
Greater Minnesota has 28 rural transit (5311) systems, five tribal transit systems and several intercity bus providers operated by local governments, joint powers organizations, non-profits and tribal governments that serve 80 Minnesota counties. There are seven small urban (5307) systems in Greater Minnesota’s metropolitan areas and 28 rural Enhanced Mobility for Seniors and Individuals with Disabilities programs (5310) across Greater Minnesota. Additionally, eight Regional Transportation Coordinating Councils and six Transit Coordination Assistance Programs are located throughout Minnesota to help reduce transportation gaps, streamline access and provide more transportation options.
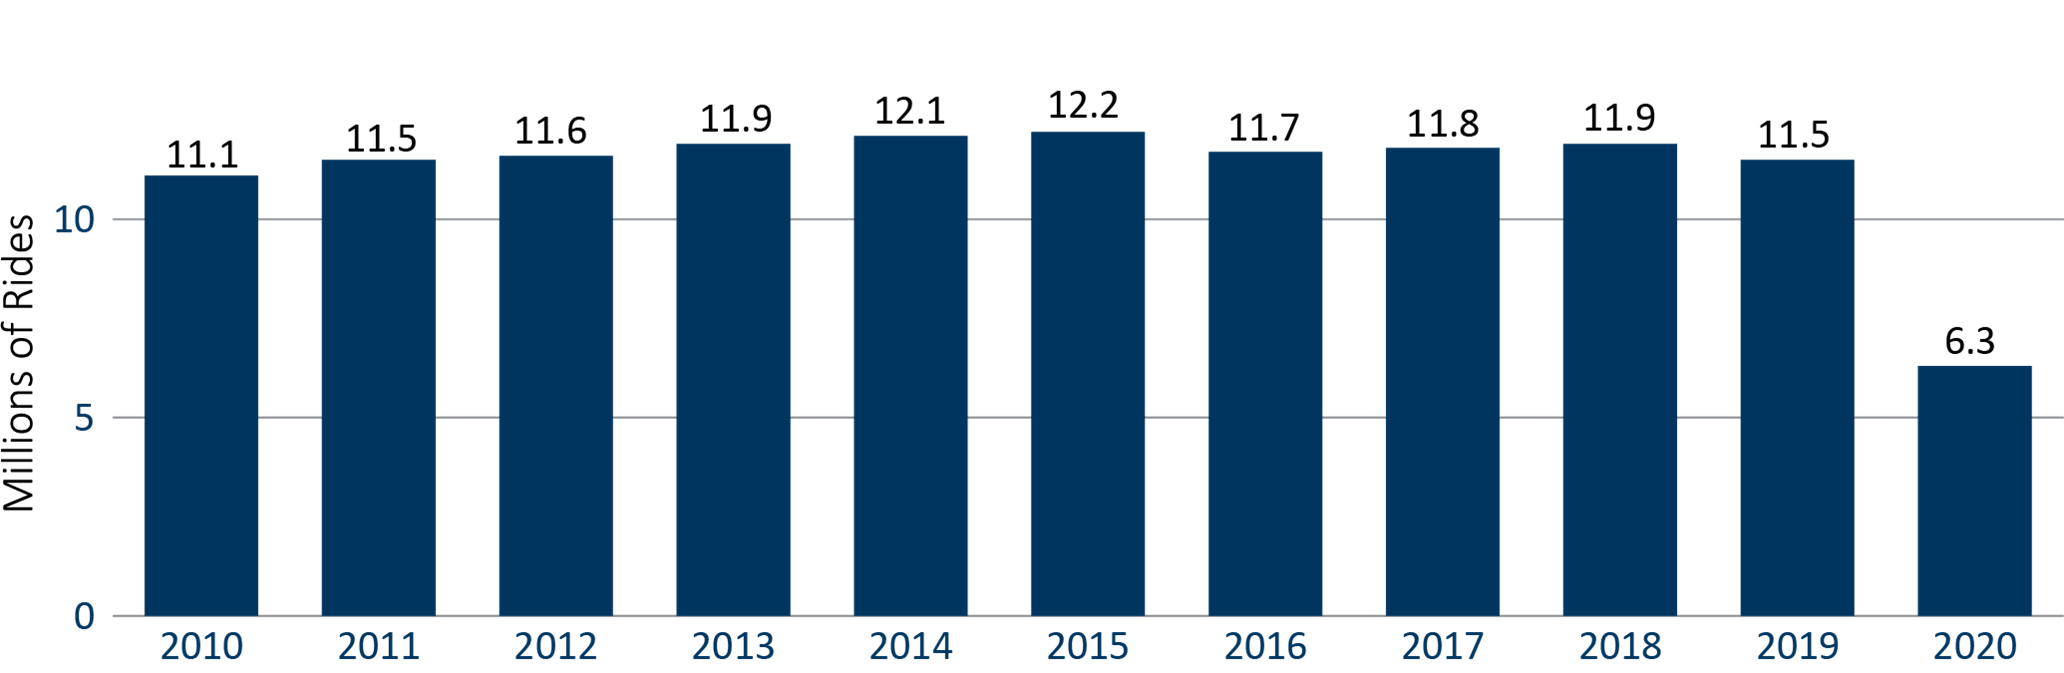
Figure 2-13 shows public transit systems in Greater Minnesota. Since the decade high in 2015 of 12.2 million, total transit ridership in Greater Minnesota has decreased over the years as shown in Figure 2-14.20 COVID-19 had a significant impact on ridership and 2020 saw nearly a 50% decrease with 6.3 million rides verses 2019’s 11.5 million.
Figure 2-13: Greater Minnesota transit service, 2021
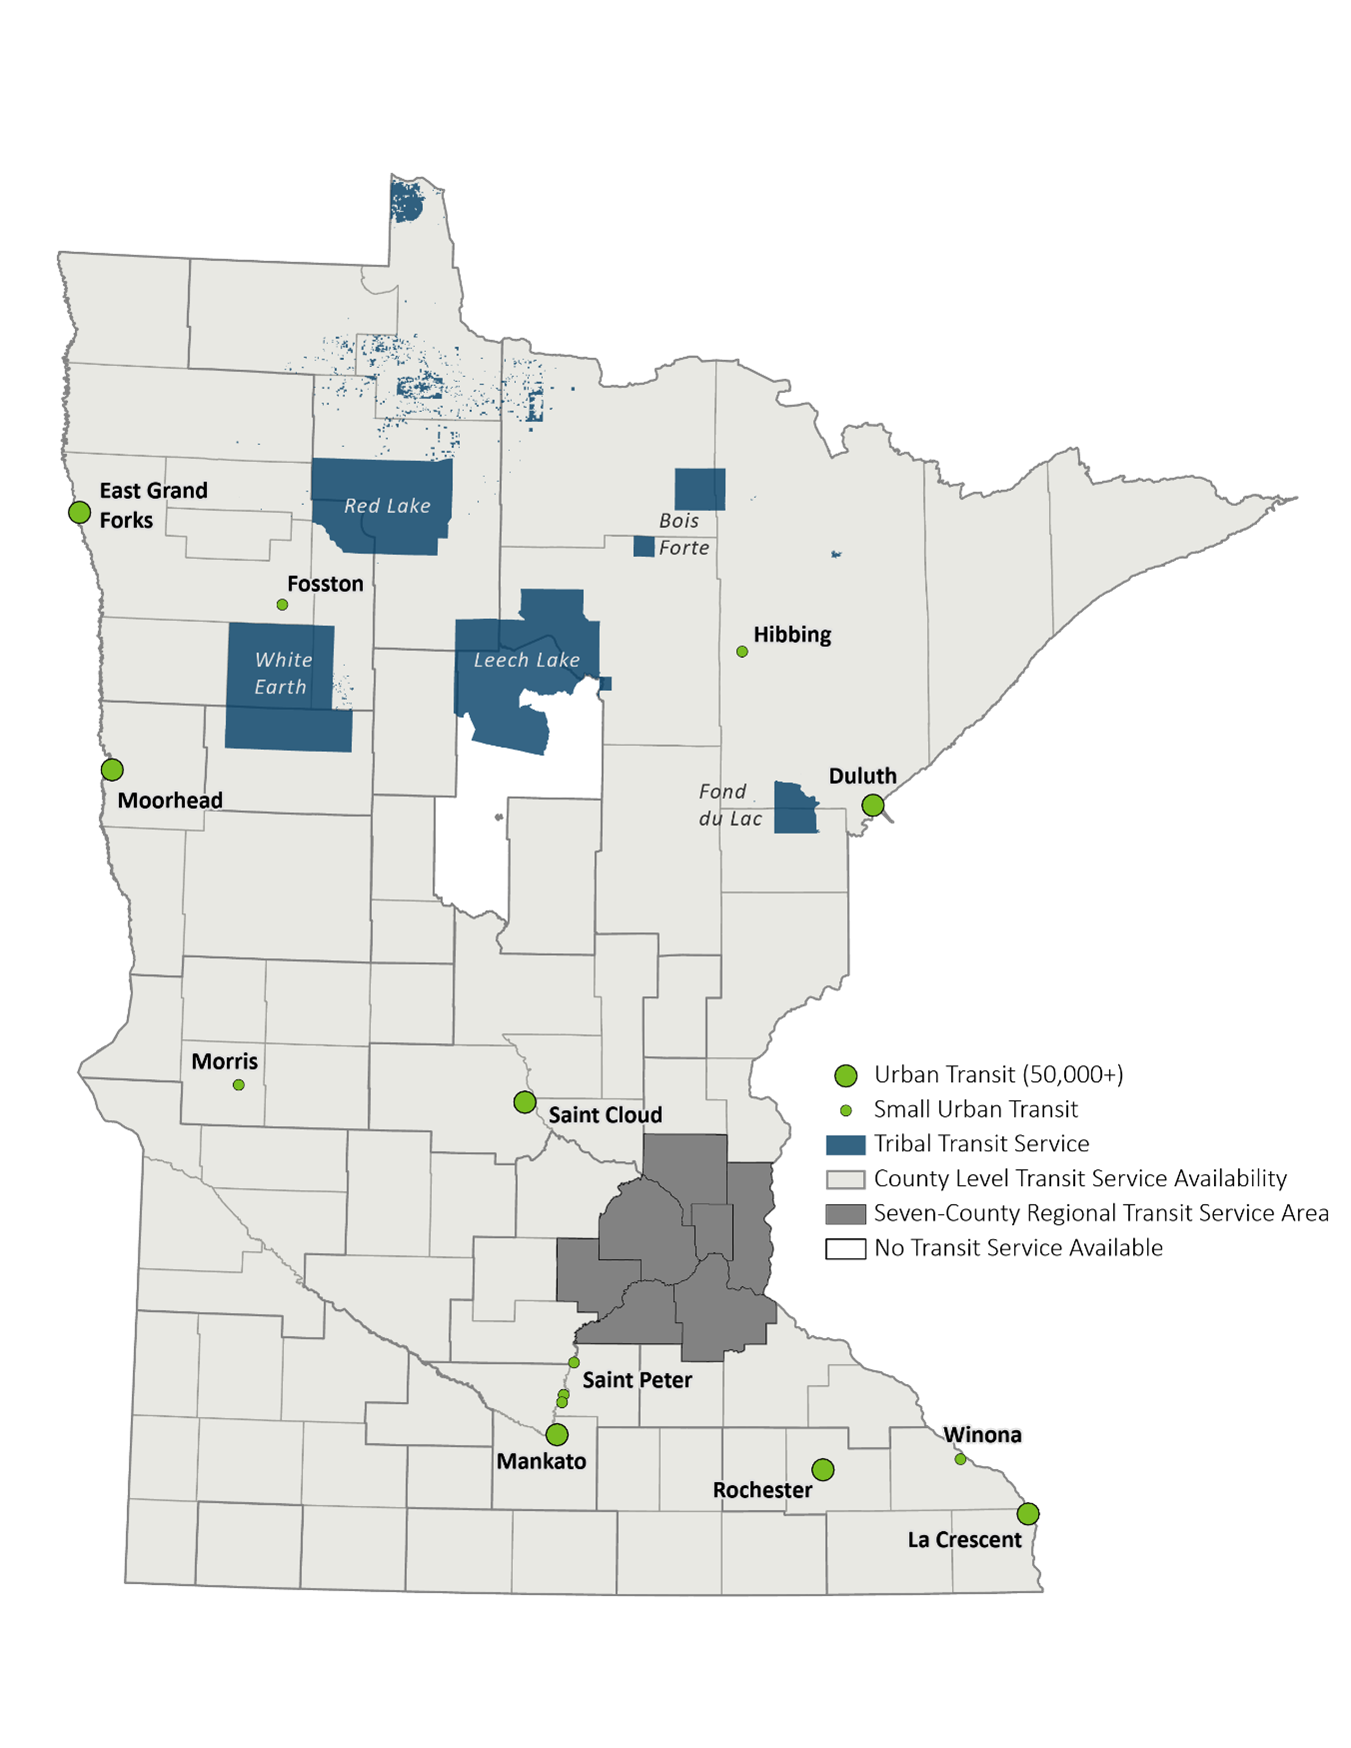
Figure 2-14: Greater Minnesota transit ridership, 2010 to 2020
INTERCITY PASSENGER RAIL & BUS SERVICES
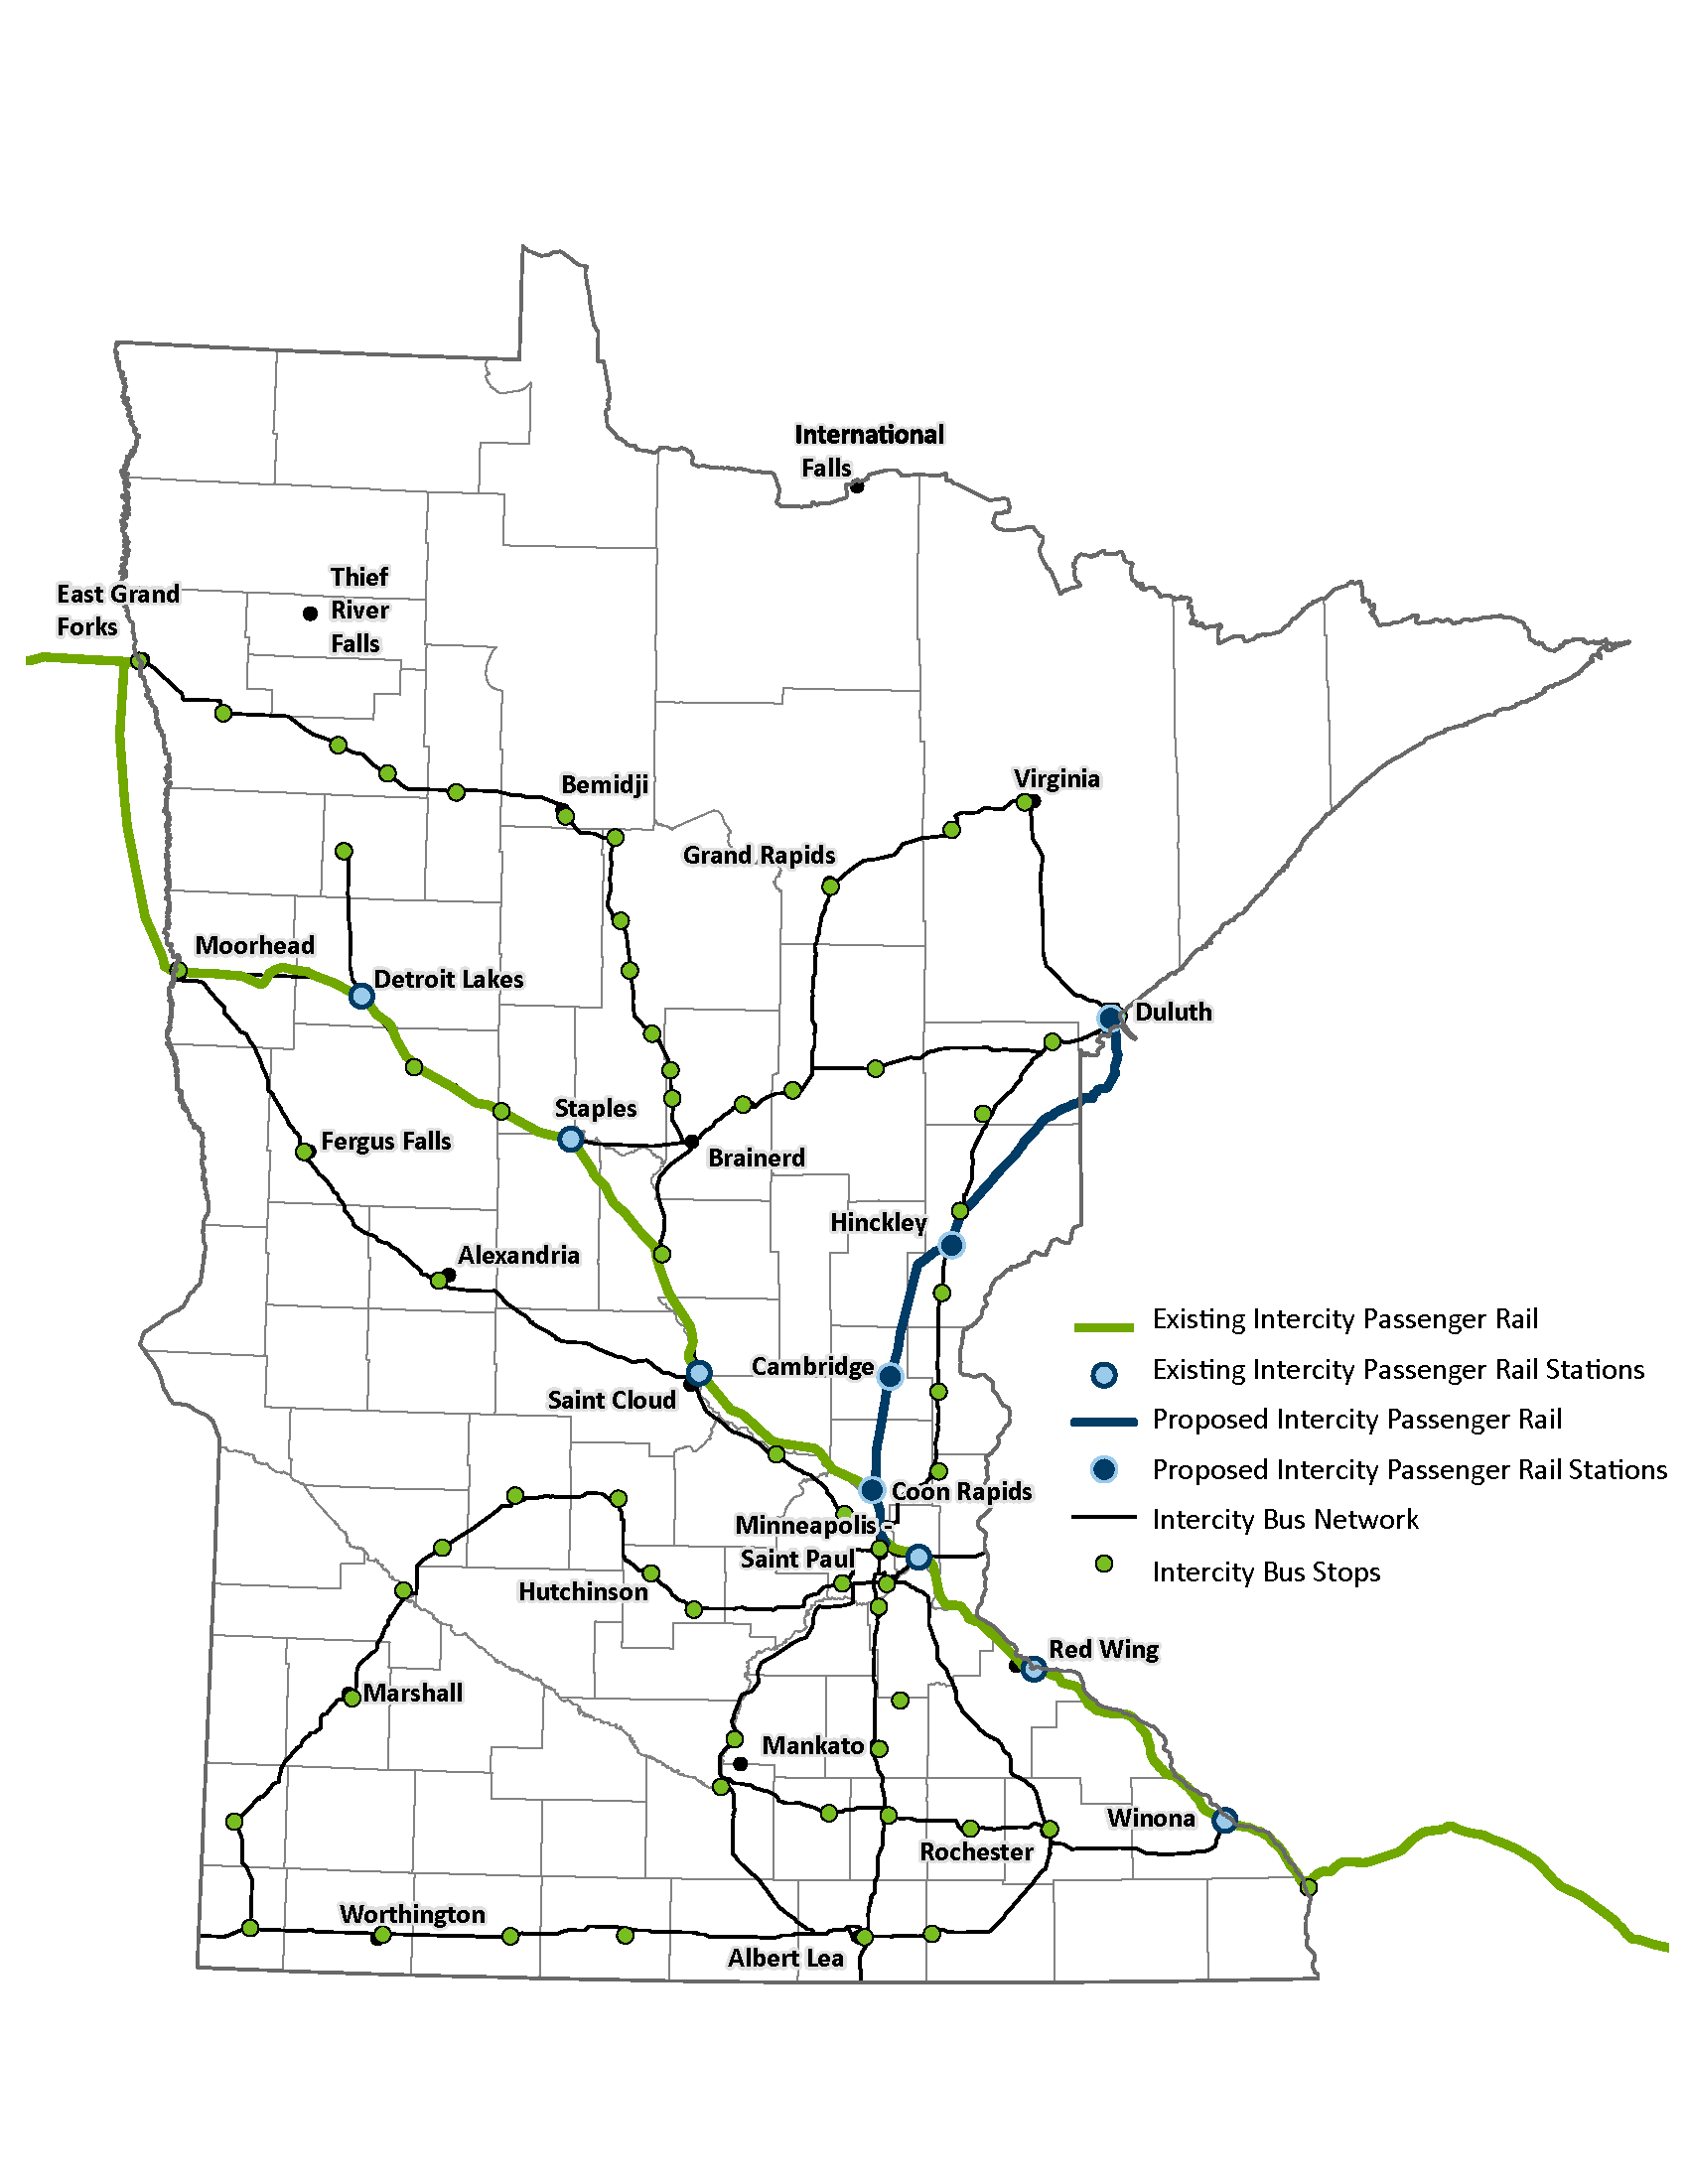
Minnesota has intercity passenger rail and bus service. Amtrak’s Empire Builder route offers passenger rail service between Chicago and the Pacific Northwest, stopping at stations in six Minnesota cities (Detroit Lakes, Staples, Saint Cloud, Minneapolis-St. Paul, Red Wing and Winona). Round-trip service is expected to be expanded in 2024 with a second daily train from St. Paul to Chicago being added to the existing Amtrak service on the Empire Builder route. Additional corridors are being considered for future passenger rail service.
Greyhound, Jefferson Lines, Land to Air Express, Megabus, Northfield Lines, Rainbow Rider and Saint Cloud NorthStar Link provide intercity bus service to 87 destinations across the state. These services also connect to every major metropolitan area in the Midwest. People took 49,801 rides on intercity bus routes in 2015 and 52,823 in 2020. During the COVID-19 pandemic, intercity bus ridership experienced an increase largely due to short term supplemental intercity bus contracts that were funded through the Coronavirus Aid, Relief and Economic Security Act (CARES Act). These contracts provided additional service beyond the regular intercity bus route services normally provided. Figure 2-15 shows the existing and planned intercity passenger rail corridors and intercity bus network in Minnesota.
Figure 2-15: Minnesota's existing and planned intercity passenger rail corridors and existing intercity bus network, 2021
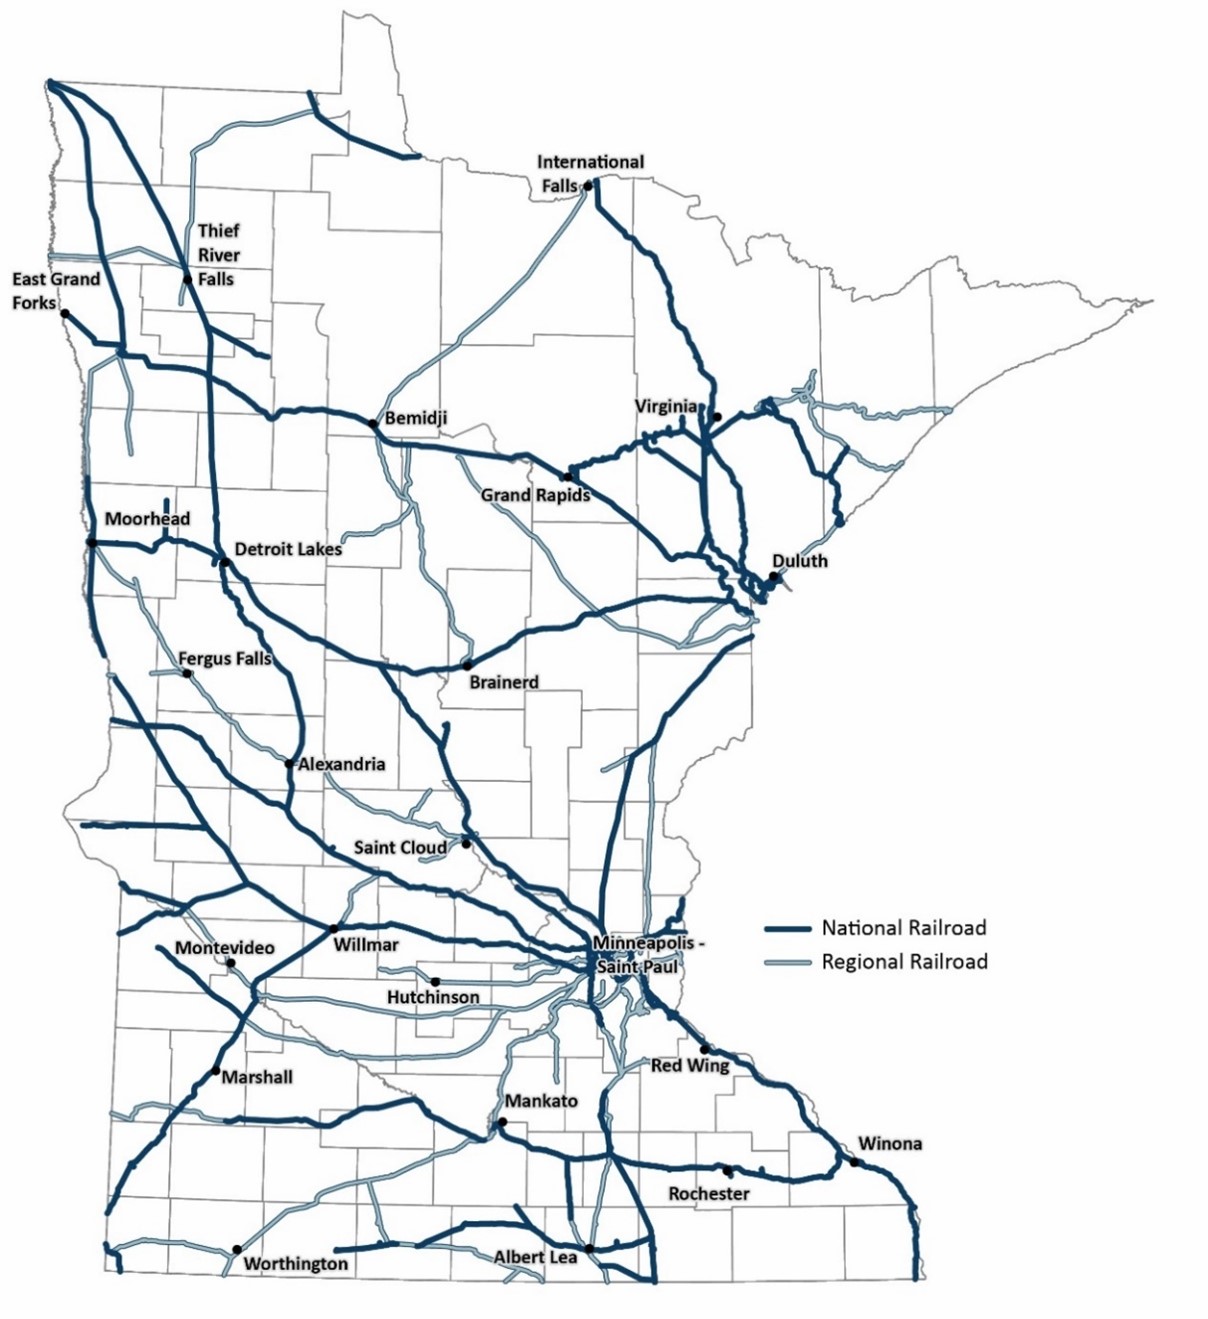
Freight Rail
As of 2021, there were 21 railroad companies operating in Minnesota on 4,444 route miles of track.21 Figure 2-17 shows the state freight rail network. The state ranks eighth in the nation for total track mileage.22 The main products shipped on Minnesota’s freight rail system are iron ores/taconite, coal, cereal grains and other food products as seen in Figure 2-16. Minnesota ranks first in the nation in tons of iron ore shipped, second in originated farm products and third for originated food products.23
Figure 2-16 shows the mix of commodities that are originated on Minnesota’s freight rail network. Iron ore and taconite are the number one commodity at 48%, 52 million tons of total materials shipped out and around the state24. Furthermore, 15% of commodities on the rail network are farm products and grain. This accounts for 12 million tons. Food products are 8% of commodities, nonmetallic minerals at 6% and chemicals at 4%. Additionally, over 6.5 million tons of commodities fall into the “other” category. In total, 88.6 million tons of commodities were originated on Minnesota’s rail network in 2019.
Figure 2-16: Commodities originated on Minnesota's freight rail network by weight, 2019
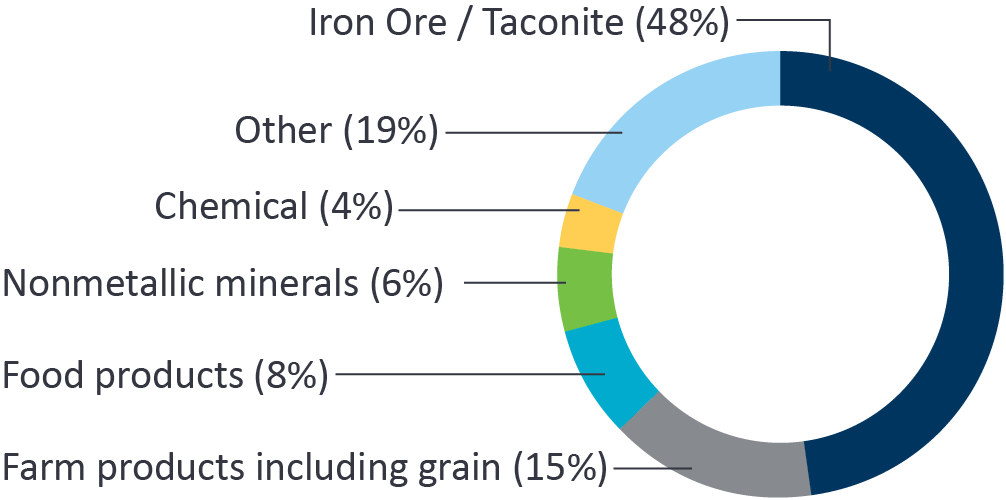
Figure 2-17: Minnesota's freight rail network, 2021
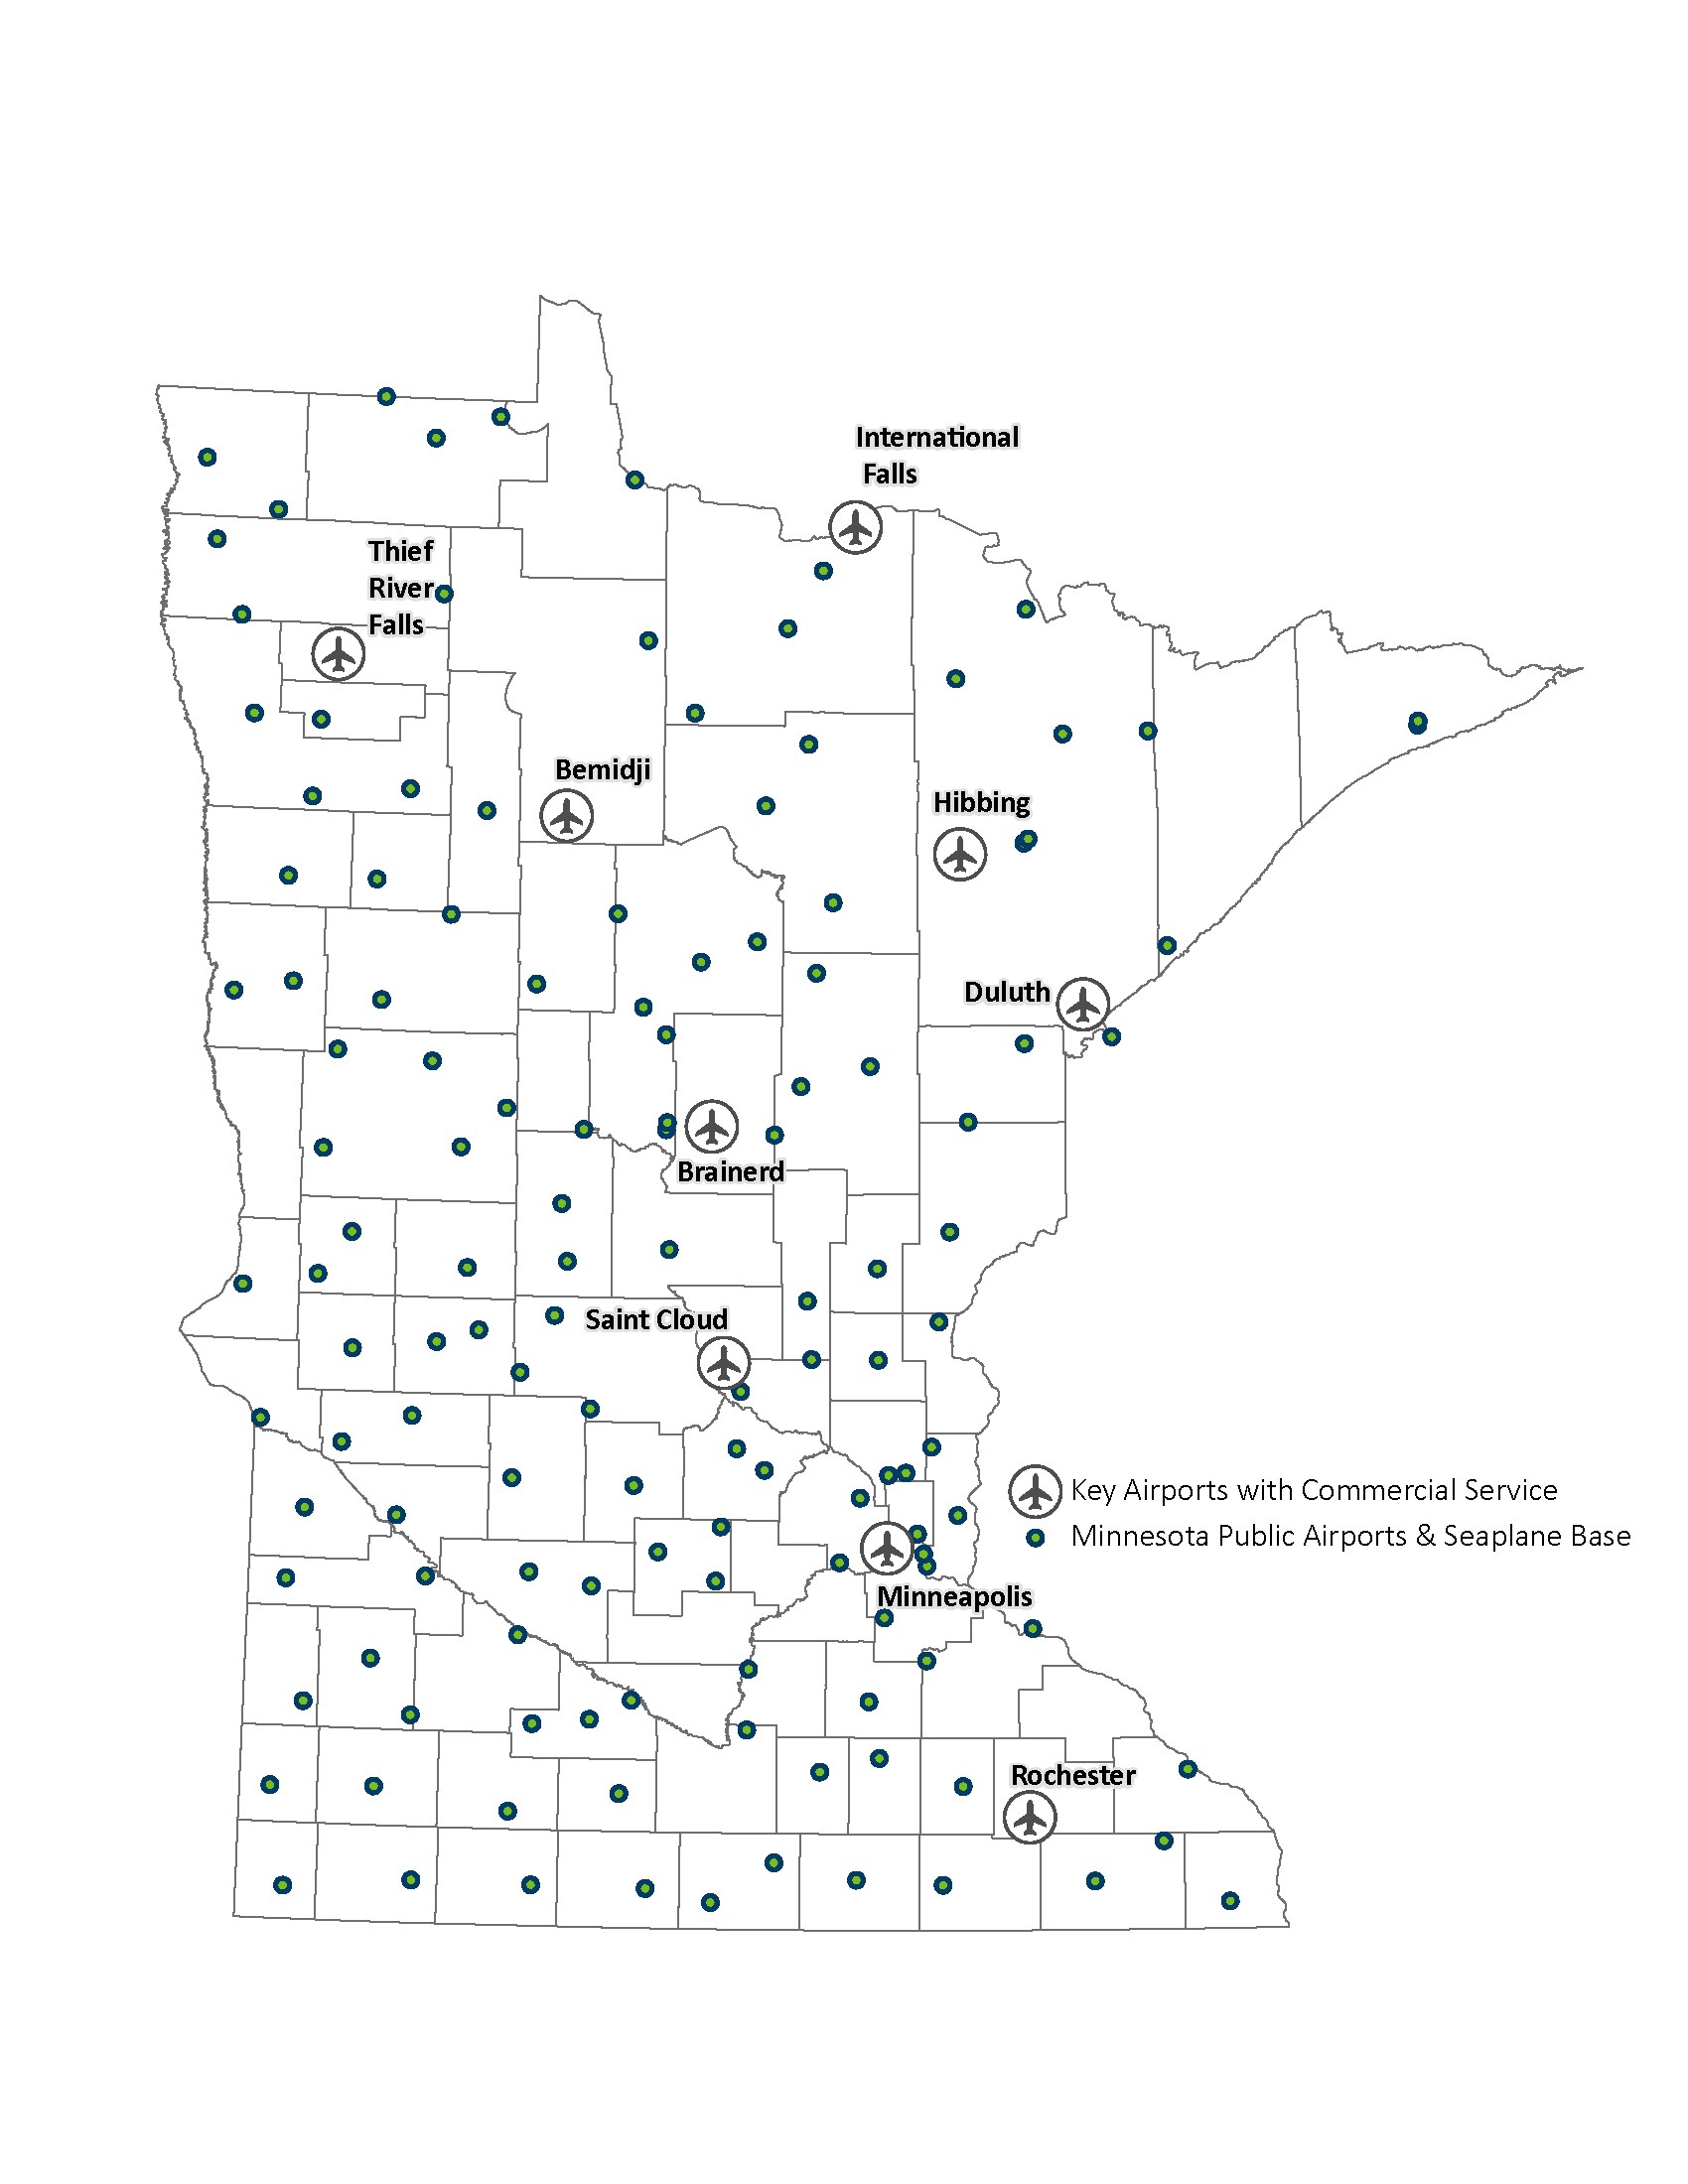
Air
Minnesota’s air transportation system includes a total of 305 airports, 133 of which are publicly funded and open to the public. Some common aviation activities include personal travel, cargo services, medical transport, agricultural spraying and aerial surveying. Nine of the state’s airports offer ticketed airline service – Minneapolis-St. Paul, Bemidji, Brainerd, Duluth, Hibbing, International Falls, Rochester, Saint Cloud and Thief River Falls.
The condition of airport runways and taxiways is important for the efficient functioning of an airport. The last time the aggregate pavement conditions were calculated was for survey year 2017. At that time, the area weighted average pavement condition for Runways and Taxiways was 91.3 on the Pavement Condition Index (PCI). The pavement conditions fluctuate over time with funding levels and other factors. The peak pavement condition was in year 2016 with a PCI index of 94.4. The previous low was in 2009 with an index of 82.9. If this pattern were to repeat itself, it is anticipated that the next low point would occur in about 2023. However, with the various federal stimulus programs, the recent funding levels have been good, and pavement conditions will be anticipated to be skewed on the high side. Since 2000, the only year that the pavement condition has been lower than the target PCI of 84 was 2009.
Airports are classified based on their size and role in supporting their community. Figure 2-18 shows the existing airport network serving Minnesota.
Figure 2-18: Minnesota's aviation system, 2021
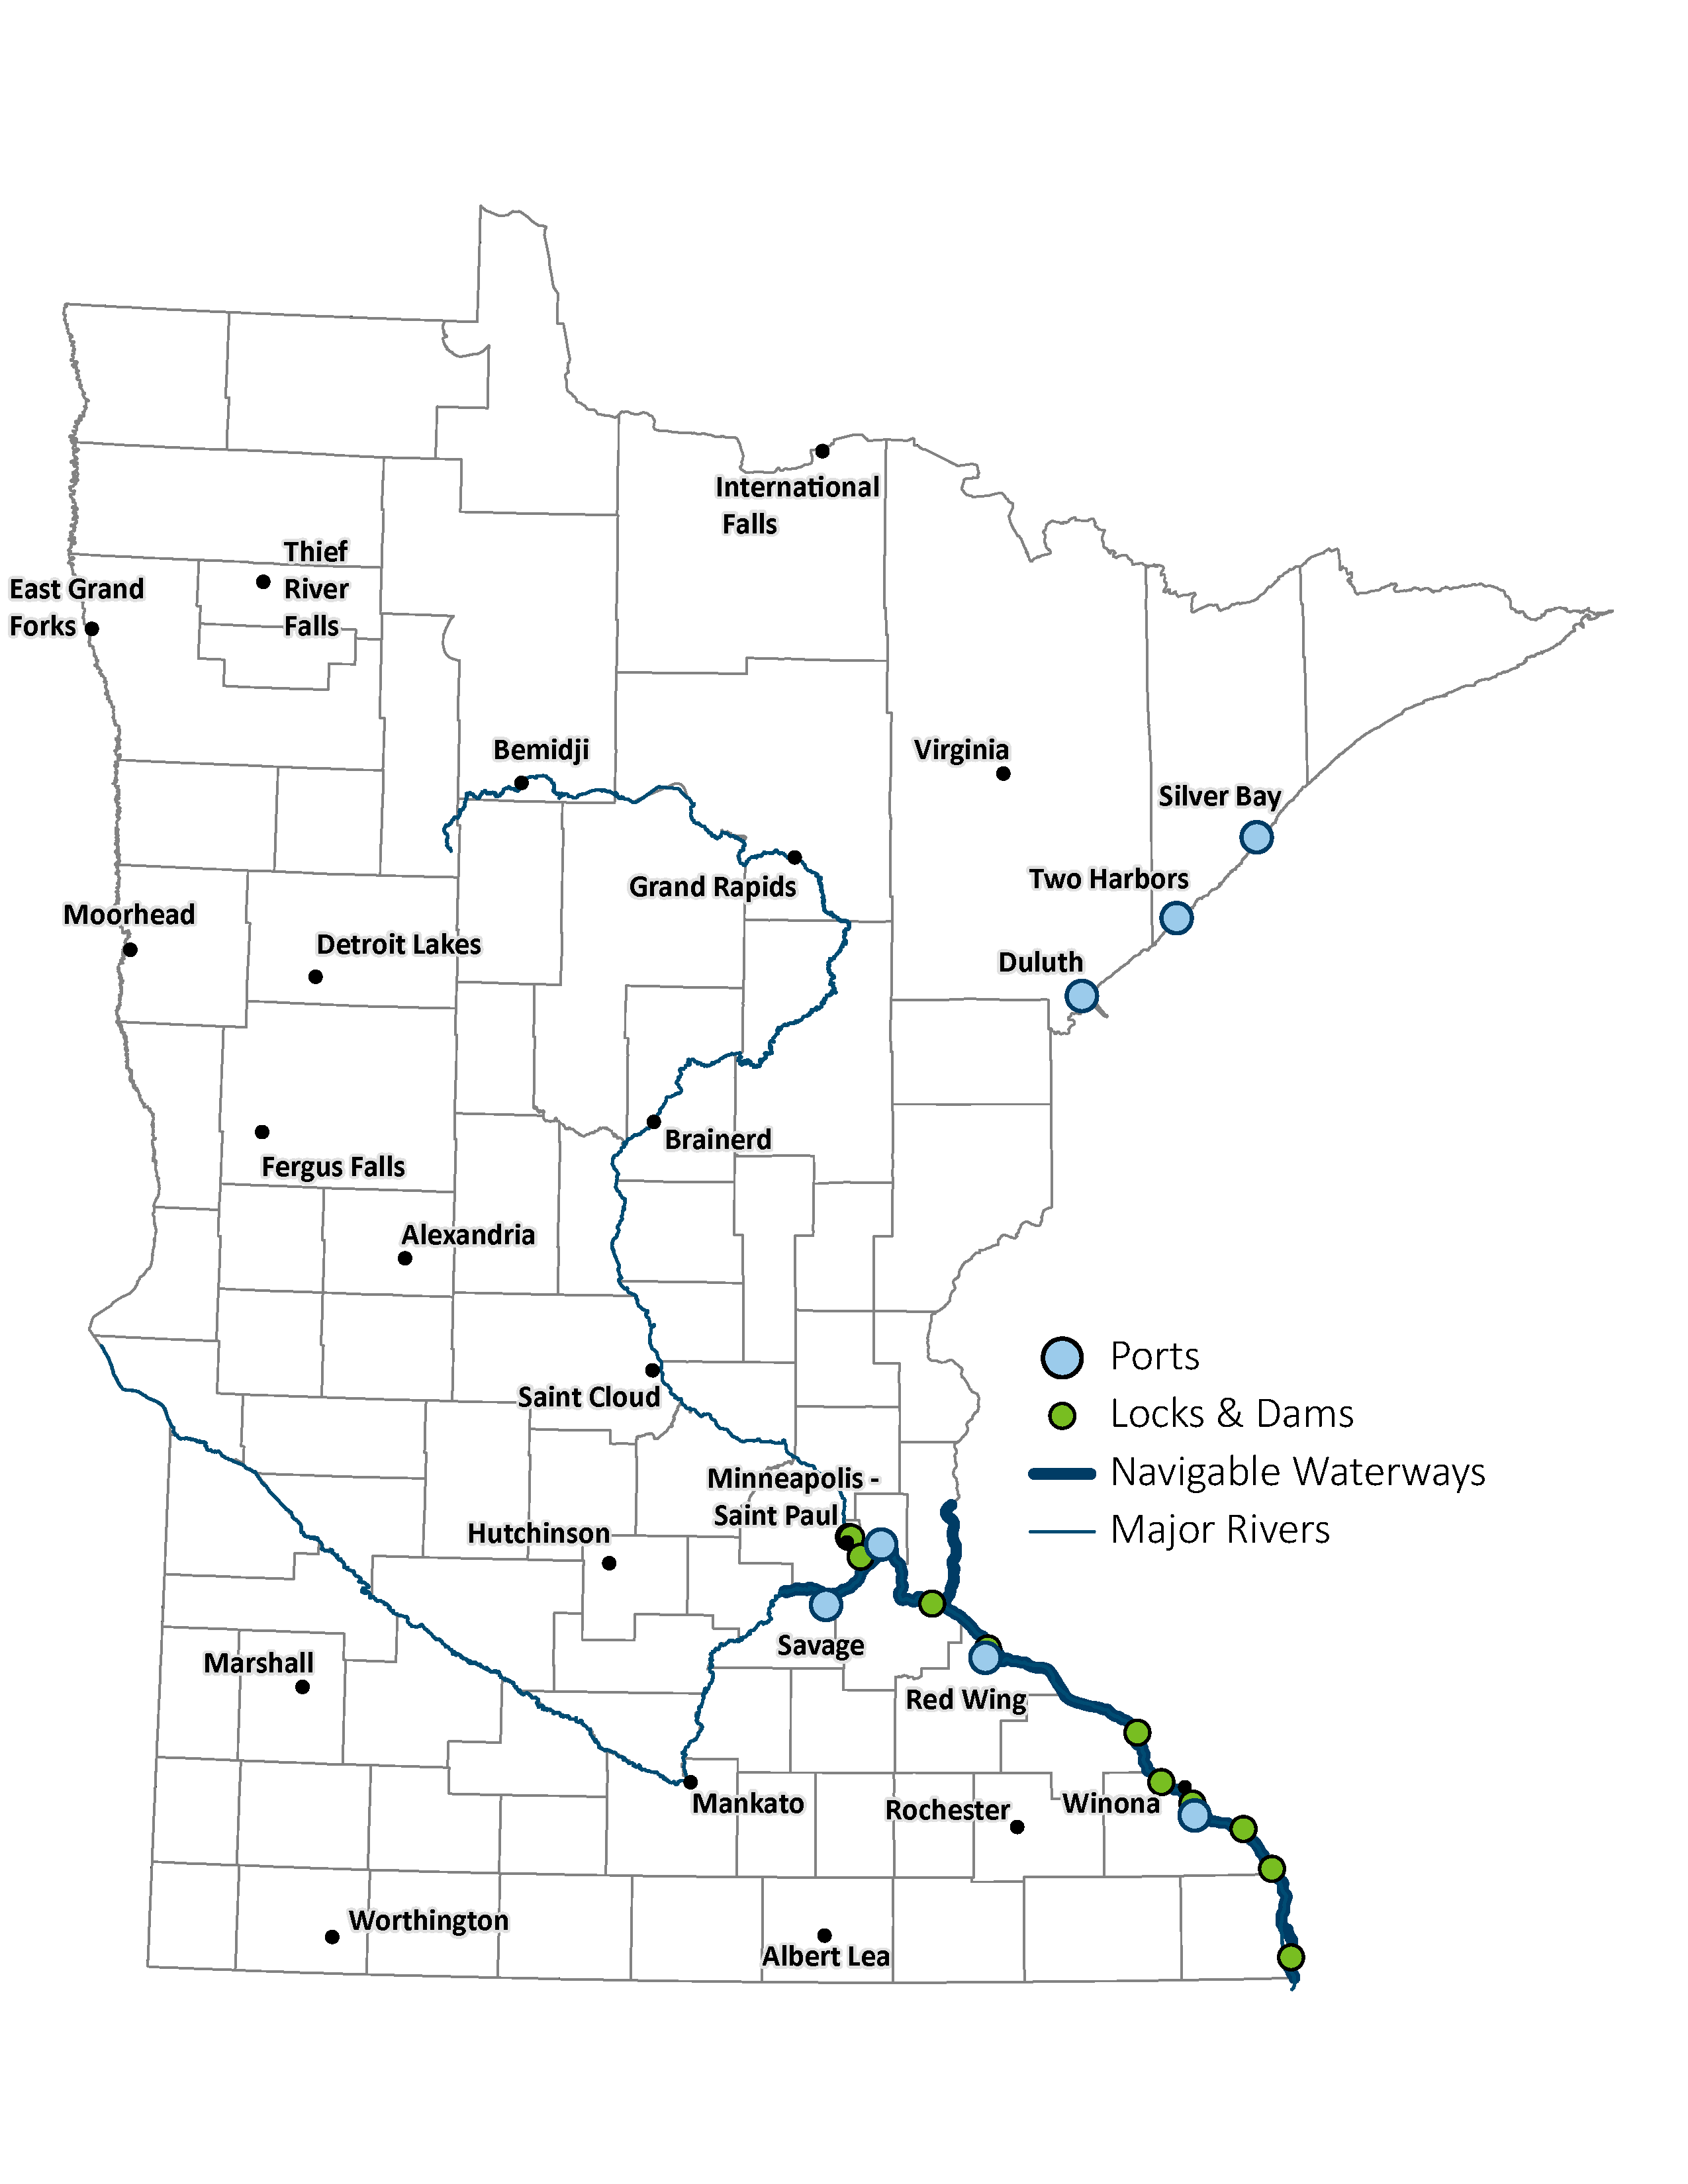
Ports & Waterways
Minnesota has three ports on Lake Superior. They are located in Silver Bay, Two Harbors and Duluth-Superior. The combined tonnage shipped from these ports in 2019 was more than 56 million tons.25
Four ports are located on 195 miles of the Mississippi River System and provide essential transportation connections and access to national and international markets. The current river ports are located in Red Wing, the Twin Cities, Savage (located on the Minnesota River, a Mississippi River tributary) and Winona. The 15 navigable miles of the Minnesota River are considered a part of the Mississippi River System. A new Wabasha port is also in development and will appear on the system within the next few years bringing the total to five ports on the Mississippi River System. These ports were used to transport over 11 million tons in 2019.
The largest commodity category by tonnage shipped on Minnesota’s waterways is iron ore, iron and steel waste and scrap metal. Figure 2-19 highlights the port and waterway system in Minnesota.
Figure 2-19: Minnesota's ports and waterway system, 2021
Transportation Funding in Minnesota
Many partners involved in Minnesota’s transportation system provide transportation funding or help decide how money is spent.
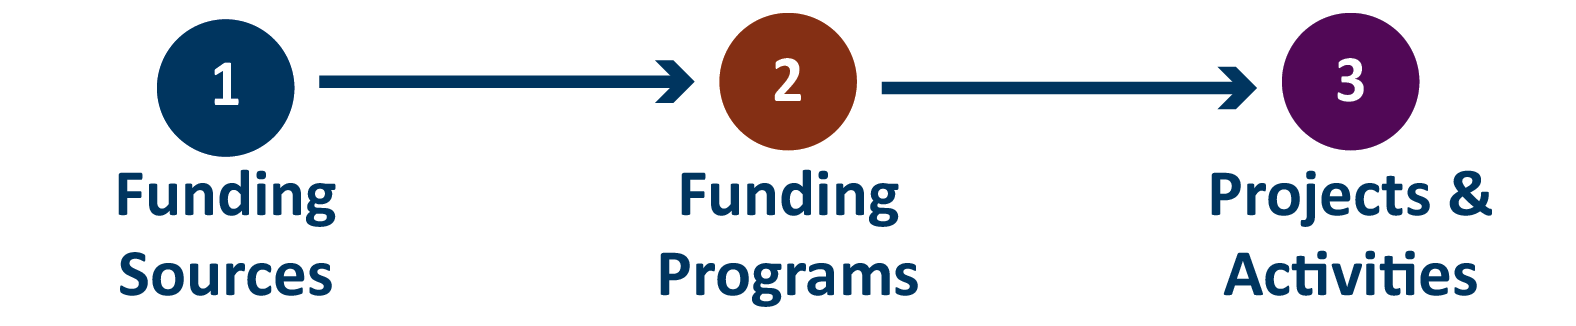
Different rules guide revenue and expenditures. All transportation modes are funded to some extent by two funding sources — transportation revenue and general revenue. Typically, funds from public sources are distributed to specific projects and activities through funding programs (Figure 2-20).
Funding for any given project depends on a variety of factors such as the project purpose, transportation mode, scope, lead organization and timing. All these funding factors, including partners, sources and programs, contribute to the process that is fundamental to maintaining and developing the Minnesota transportation system.
Putting it all together is a complex puzzle. See Appendix F – Transportation Funding for a more detailed overview of Minnesota’s transportation funding process. Chapter 7 includes more information on the need for sustainable transportation funding as part of implementing the SMTP.
Figure 2-20: Transportation funding process
- Minnesota Department of Transportation, “Centerline and Lane Mileage Reports,” Office of Transportation System Management, December 31, 2021, https://www.dot.state.mn.us/roadway/data/reports/mlm/21_strgp.pdf.
- Centerline miles is a term for one mile of a single roadway regardless of the number or size of the lanes.
- Minnesota Department of Transportation, “Vehicle Miles of Travel Trends in Minnesota,” Office of Transportation System Management, September 2019, https://www.dot.state.mn.us/traffic/data/reports/vmt/VMT_Trend_Report_2018.pdf.
- Minnesota GO, “Transportation Behavior,” Trend Library, 2022, https://minnesotago.org/trends/transportation-behavior.
- Minnesota Department of Transportation, “Performance Measures,” date accessed March 9, 2022, https://www.dot.state.mn.us/measures/.
- Minnesota Department of Transportation, “Regional Transportation Management Center,” date accessed March 9, 2022, https://www.dot.state.mn.us/rtmc/trafficoperations.html.
- Metropolitan Council, “Freeway Travel Trends,” date accessed March 9, 2022, http://metrotransitmn.shinyapps.io/freeway-traffic-trends/ .
- Minnesota Department of Transportation, “2020 Pavement Condition Annual Report,” March 2021, https://www.dot.state.mn.us/materials/pvmtmgmtdocs/AnnualReport_2020.pdf.
- Minnesota GO Performance Dashboard, “Bridge Condition,” date accessed March 9, 2022, https://performance.minnesotago.org/system-stewardship/condition/bridge-condition.
- Minnesota GO Performance Dashboard, “Bridge Condition,” date accessed March 9, 2022, https://performance.minnesotago.org/system-stewardship/condition/bridge-condition.
- Minnesota Department of Transportation, “Minnesota Structures 2021 Report, Bridge Office – Bridge Inventory Management Unit.
- Minnesota Department of Public Safety, “Bike and Pedestrian Safety,” Office of Traffic Safety, 2016-2020, https://dps.mn.gov/divisions/ots/pedestrians-bicycles/Pages/default.aspx.
- Minnesota Department of Public Safety, “2020 Minnesota Annual Report,” Office of Traffic Safety, 2020, https://dps.mn.gov/divisions/ots/reports-statistics/Documents/Annual-Report-2020.pdf.
- Minnesota Department of Transportation, “Omnibus Public Opinion Survey,” MnDOT Public Engagement and Constituent Services Office, MnDOT 2017, 2019, 2020.
- Minnesota Department of Transportation, “Minnesota’s Walking and Bicycling Data Collection Report Update,” Office of Transit and Active Transportation, February 22, 2021, http://www.dot.state.mn.us/bike-ped-counting/reports/2018-2019%20MinnesotaPedBikeCountReport.pdf.
- Metropolitan Council, “2019 Travel Behavior Inventory Household Survey Results,” 2019, https://metrocouncil.org/Transportation/Performance/Travel-Behavior-Inventory/2019.aspx.
- Metropolitan Council, “2021 Regional Transit Ridership,” 2021, https://metrocouncil.org/Transportation/Planning-2/Reports/Transit-Transitways/Regional-Transit-Ridership.aspx.
- Metro Transit, “Metro Transit Facts,” December 31, 2020, https://www.metrotransit.org/metro-transit-facts.
- Metropolitan Council, “2021 Year End Ridership,” Transportation Committee, February 14, 2022, https://metrocouncil.org/Council-Meetings/Committees/Transportation-Committee/2022/February-14,-2022/2021-Year-End-Ridership-Report.aspx.
- Minnesota GO Performance Dashboard, “Annual Greater Minnesota Transit Ridership,” date accessed March 9, 2022, https://performance.minnesotago.org/critical-connections/access/annual-boardings-recorded-public-transit-providers-serving-greater-minnesota-counties-amtpr.
- Minnesota Department of Transportation, “About Railroads in Minnesota,” date accessed March 9, 2022, https://www.dot.state.mn.us/aboutrail/index.html.
- American Association of Railroads, “State Rankings – total rail miles by State: 2020,” 2019, https://www.aar.org/wp-content/uploads/2021/02/AAR-State-Rankings-2019.pdf.
- Minnesota Department of Transportation, “State Rail Plan,” March 2015, Office of Freight and Commercial Vehicle Operations, https://www.dot.state.mn.us/planning/railplan/2015report/DraftMNStateRailPlan.pdf.
- Minnesota Regional Railroads Association, “Information about Minnesota’s Railroads,” 2021-2022, https://www.mnrailroads.com/assets/MRRA%202021-22.pdf.
- Minnesota Department of Transportation, “Ports and Waterways,” Office of Freight and Commercial Vehicle Operations, date accessed March 9, 2022, https://www.dot.state.mn.us/ofrw/waterways/commercial.html.