
Minnesota’s Freight Assets and Use
This chapter describes Minnesota’s multimodal freight system, how this system is used, and the designation of Minnesota’s Principal Freight Network.
Minnesota’s Freight System Assets
The following sections briefly describe the modal sections of Minnesota’s multimodal freight network – highways, railroads, ports and waterways, airports and pipelines. Maps and data on Minnesota’s multimodal freight system can be found in the Minnesota’s Principal Freight Network and Freight System Assets and Use technical memos.
Highway System
The trunk highway system (Interstates, U.S. Highways, and Minnesota State Highways) is the only freight modal network under MnDOT’s jurisdiction. It is the backbone for goods movement in Minnesota, and provides first- and last-mile connectivity to all industries. Minnesota’s trunk highway system totals nearly 12,000 miles of roadway, and many of these highways average more than 5,000 truck trips per day. For long trips, trucks typically use designated highway networks to transport goods from point to point. In addition to these state and federally designated roadways, local roadways also serve as important connectors between freight generating and receiving facilities (farms, processing plants, manufacturing centers and distribution centers) and the primary roadway network.
Freight Rail System
Minnesota’s rail network historically has played a major role in supporting freight movements for key commodity groups and industries, particularly for the state’s agricultural producers and shippers. In addition, the state’s rail network supports regional and national goods movement between major shipping centers in Chicago and points west, including Pacific Northwest Ports. The four primary Class I rail operators in the state are BNSF with about 1,600 miles of track, Canadian Pacific (CP) with 650, Union Pacific (UP) with 500, and Canadian National (CN) with 450. In addition, 17 other short line or other regional railroads operate in Minnesota.
Ports and Waterway System
Minnesota has one of the more unique positions in the country for waterway movements as it is located on both the Mississippi River and the Great Lakes via Lake Superior. The Mississippi River provides access to river ports to the south and the Gulf of Mexico via New Orleans. The Great Lakes-St. Lawrence Seaway provides access to other ports along the Great Lakes to the Atlantic Ocean. Due to this, Minnesota has four public and four private port authorities in operation: four on the Mississippi River system and four along Lake Superior.
Airport System
Minnesota is home to 97 airports listed in the Federal Aviation Administration’s National Plan of Integrated Airport Systems. This list is updated every two years to identify existing and proposed airports that are considered significant to national air transportation. Of these, seven are identified as primary airports. Seven other airports, all located near the Minneapolis-St. Paul International Airport, are identified as relievers. The seven primary airports are:
- Bemidji Regional Airport
- Brainerd Lakes Regional Airport
- Duluth International Airport
- Falls International Airport, International Falls
- Minneapolis – St. Paul International Airport
- Range Regional Airport, Hibbing
- Rochester International Airport
These seven are considered primary airports due to the volume of passenger boardings (at least 10,000 per year). With the exception of MSP, most would not meet the criteria for primary airport status based only on the air cargo threshold (at least 100 million pounds of total annual landed weight by cargo aircraft).
Pipeline System
The National Pipeline Mapping System, maintained by the Pipeline and Hazardous Materials Safety Administration, shows more than 9,000 miles of pipeline in the state. Due to the sensitive nature of this mode, detailed maps of pipeline infrastructure are not available. The primary pipeline system in Minnesota is the Minnesota Pipe Line system. This pipeline receives crude oil from other pipeline systems (e.g., the Enbridge Pipeline System that carries crude from Alberta, Canada) at a terminal in Clearwater County. The Minnesota Pipe Line system has four lines running from Clearbrook to the Twin Cities and can transport about 465,000 barrels of crude oil per day. 1 Minnesota’s pipeline system also includes two refineries and six refined asset terminals.
Minnesota Freight System Demand
The needs of Minnesota’s freight system are driven by freight demand – what and how much is traveling on the system, where it is coming from, and where it is destined. This section presents existing and potential demand for freight in Minnesota. During the next few decades, there will be unanticipated changes in the economy, freight logistics, technology, public policy, and other factors that will greatly influence the general demand for goods movement and that of the individual modes. While these unanticipated changes are not reflected in this plan, they were considered in developing the plan’s recommendations.
Freight Movements by Mode
In 2012, one billion tons of freight moved over Minnesota’s transportation system, as shown in Figure 2.1. Trucks carried 63 percent of all freight tonnage to, from, within and through Minnesota, while rail (carload and intermodal) carried about 25 percent. By 2040, the forecast indicates total volume of 1.8 billion tons, an increase of 80 percent overall.
Figure 2.1 - Mode Share by Weight, 2012 and 2040
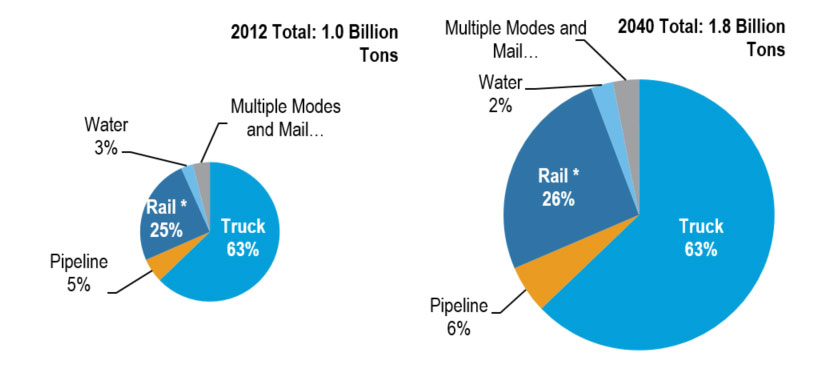
Source: Federal Highway Administration (FHWA) Freight Analysis Framework (FAF3) 2015 Provisional estimates and 2040 Forecast, and through truck traffic estimated by routing these data; and, STB 2012 Confidential Carload Waybill Sample and FHWA FAF 3.5 forecast for 2040 processed by Cambridge Systematics.
Note: *Rail intermodal was excluded from Multiple Modes and Mail and included in Rail. Multiple Modes and Mail includes overnight mail and package delivery services.
Figure 2.2 shows the proportional value carried by each of Minnesota’s freight modes. In 2012, $912 billion in freight moved over the state’s transportation system, an amount that is expected to grow 161 percent to $2.3 trillion by 2040. Trucks carried 67 percent of the state’s freight value, and by 2040 this share is expected to decrease to 63 percent. Rail carried 21 percent of the freight value; this share is expected to remain somewhat constant through the forecast period.
Figure 2.2 - Mode Share by Weight, 2012 and 2040
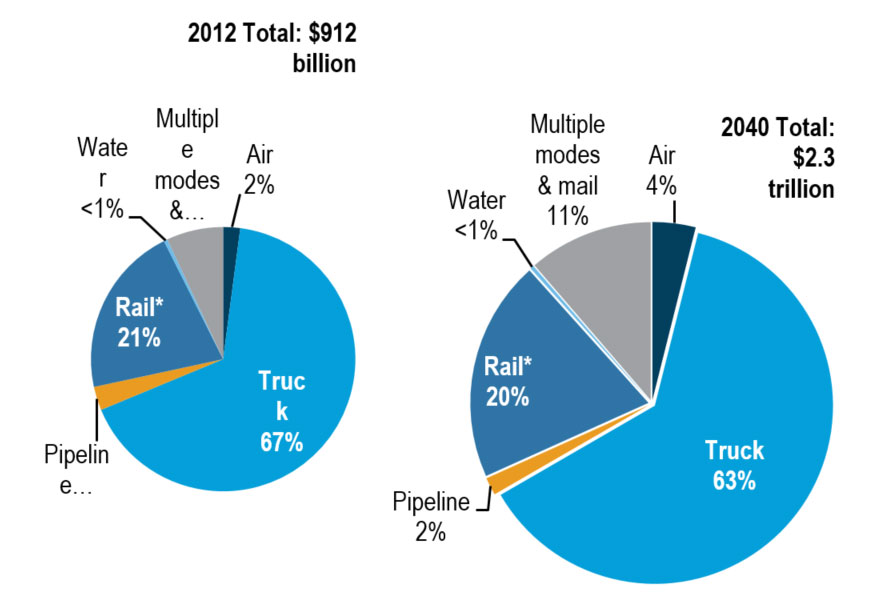
Source: FHWA FAF3 2015 Provisional estimates and 2040 Forecast, and through truck traffic estimated by routing these data; and, STB 2012 Confidential Carload Waybill Sample and FHWA FAF 3.5 forecast for 2040 processed by Cambridge Systematics.
Note: *Rail intermodal was excluded from Multiple Modes and Mail and included in Rail. Multiple Modes and Mail includes overnight mail and package delivery services.
Freight Movements by Direction
The relationship between tonnage and value of goods shipped and how the nature of different transportation modes affect this relationship is well demonstrated in Minnesota. Figure 2.3 displays the tonnage and value of commodities by both mode and direction (inbound, outbound and within Minnesota). As shown in the figure, air has an almost negligible effect on the overall state tonnage; however, for overall value, air represents almost 5 percent. This confirms that air cargo is typically comprised of lower weight and higher value goods. Rail is most economical over longer distances, explaining why it has a large share of outbound and inbound movements at 31 and 39 percent, respectively, and a relatively small share of within-state movements (6 percent).
Figure 2.3 - Statewide Tonnage (left) and Value (Right) of Commodities by Mode and Direction, 2012.
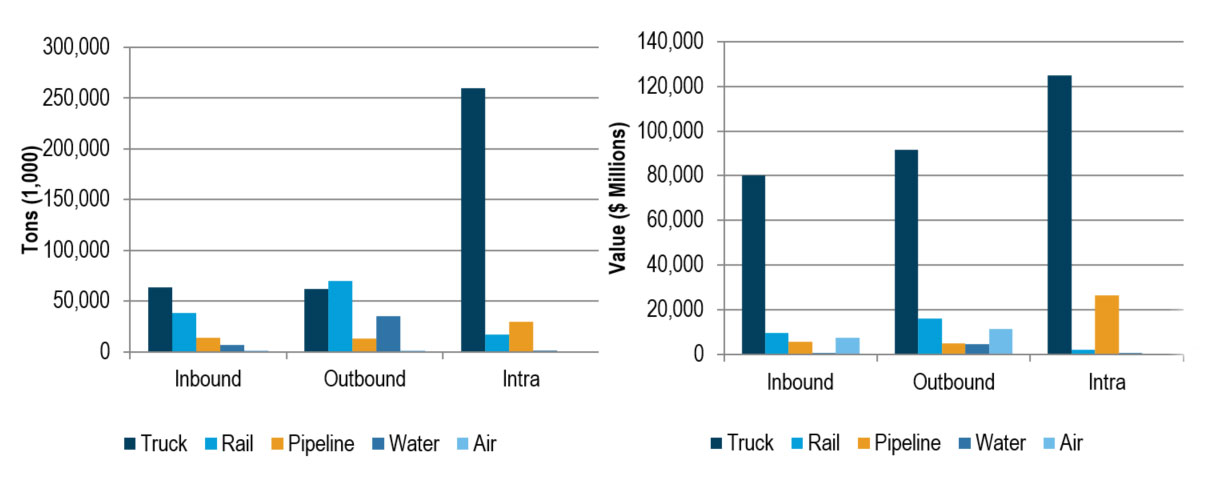
Source: FHWA FAF3 2015 Provisional estimates, Waterborne Commerce Statistics Center, Minneapolis – St. Paul International Airport Year End Operations Reports (2008-2013), Minnesota State Aviation System Plan.
Major Freight Commodities
At the statewide level, Cereal Grains are the prime commodity representing 23 percent of total tonnage, as displayed in Figure 2.4. The next largest commodity by tonnage is Metallic Ores at 9 percent. This is primarily due to taconite mining in the northeast part of the state.
Looking ahead to 2040, tonnage is anticipated to increase at an annual rate of 2 percent, resulting in overall tonnage nearly doubling by 2040 (illustrated in Figure 2.1); however, the distribution of commodities remains steady. Figure 2.4 shows the large role that agricultural products play in the state’s economy. Other Agricultural Products, Animal Feed, and Milled Grain Products are all anticipated to at least double in tonnage by 2040. Conversely, Metallic Ores will drop from the second highest commodity in the state to sixth. Some of this may be due to environmental concerns regarding mine operations or the overall capacity of the existing mines.
Figure 2.4 - Major Freight Commodities by Tonnage, 2012 (left) and 2040 (right)
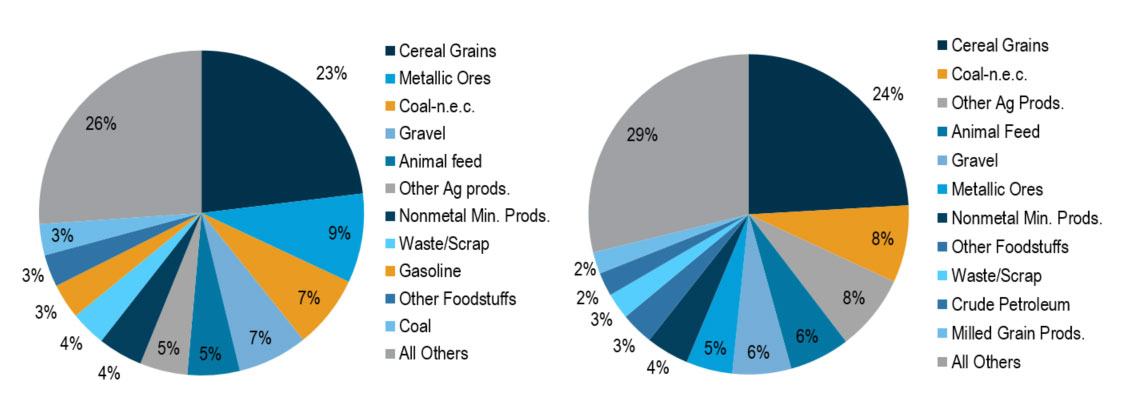
Source: FHWA FAF3 2015 Provisional estimates
Note: Coal-n.e.c. refers to coal and petroleum products not elsewhere classified, including natural gas.
By value, the list of major commodities changes significantly. Cereal Grains represent 23 percent of all tonnage, but only comprises 4 percent of the total value of commodities moved throughout the state. As shown in Figure 2.5, higher value goods such as Electronics and Machinery contribute more to the overall value of goods moved. At 8 percent each, these commodities are not nearly as dominant as Cereal Grains are by tonnage. Each of these top 10 commodities have a roughly equal share of value, ranging from 4 to 8 percent of the total. Some low value goods, such as Cereal Grains and Coal-n.e.c., 2 only appear here due to the sheer volume of goods moved while many of the most valuable commodities do not appear on the list of top 10 commodities by tonnage.
By 2040, Precision Instruments are anticipated to have tremendous growth in Minnesota. With a growth of nearly 1,000 percent (nine percent annually), this commodity will represent 23 percent of the total value of commodities moved to, from, and within Minnesota. The next highest share of commodities will be Machinery and Electronics at 9 percent and 8 percent, respectively, similar to what they are today. As Figure 2.5 shows, most of the other commodities have more moderate growth between 2 and 5 percent annually. The other commodity with significant movement is Pharmaceuticals. Presently, these goods do not appear on the top 10 list by value yet move up to seventh place by 2040 due to an annual growth rate of 5 percent.
Figure 2.5 - Major Freight Commodities by Value, 2012 (left) and 2040 (right)
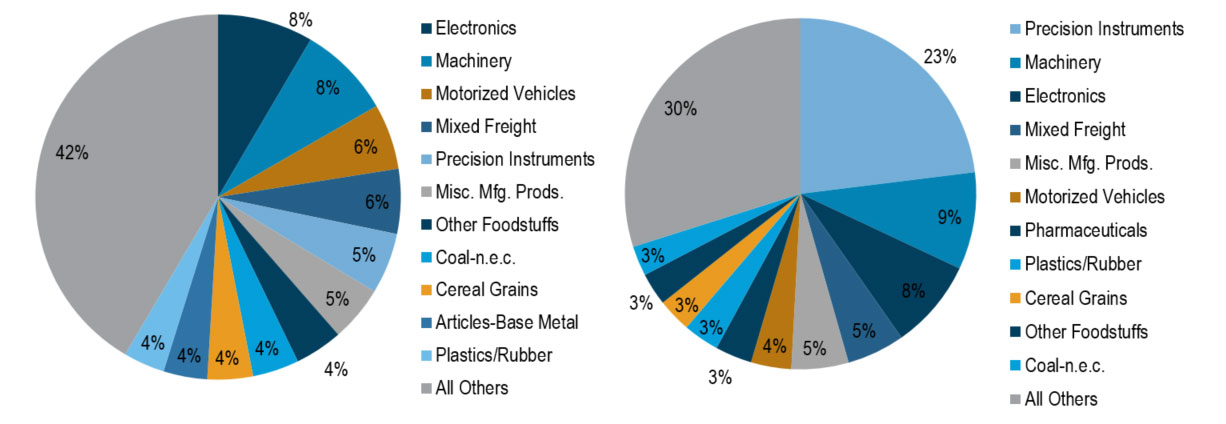
Source: FHWA FAF3 2015 Provisional estimates
Note: Coal-n.e.c. refers to coal and petroleum products not elsewhere classified, including natural gas.
Minnesota’s Trading Partners
Minnesota is well positioned to take advantage of a variety of trade partners. The most convenient partners are other states within the U.S. International goods also pass through Minnesota’s ports of entry by land, air and water. Minnesota’s largest domestic trading partners, today and in the future, are neighboring states, as shown Figure 2.6. Today, those states sharing a border with Minnesota (Wisconsin, Iowa, South Dakota and North Dakota) make up 40 percent of total trade with other states.
Looking ahead to forecasted growth, Wisconsin is expected to lose its number one spot on Minnesota’s list of domestic trade partners to North Dakota. North Dakota is anticipated to experience a drastic increase in tonnage moved with the state. This growth is almost singularly related to a significant growth in cereal grains imported into Minnesota from North Dakota. Current volumes for this commodity are estimated at more than 1.7 million tons, and by 2040 this is expected to grow to nearly 59 million, representing an annual growth of 12 percent. While this growth seems large, crop developments are already underway to justify this expected growth. Winter wheat in North Dakota grew by 264 percent between 2013 and 2014 alone. Other types of grains, such as durum wheat, spring wheat and flaxseed, are all anticipating significant growth.3
Figure 2.6 - Major Domestic Trading Partners by Total Tonnage, 2012 (left) and 2040 (right)
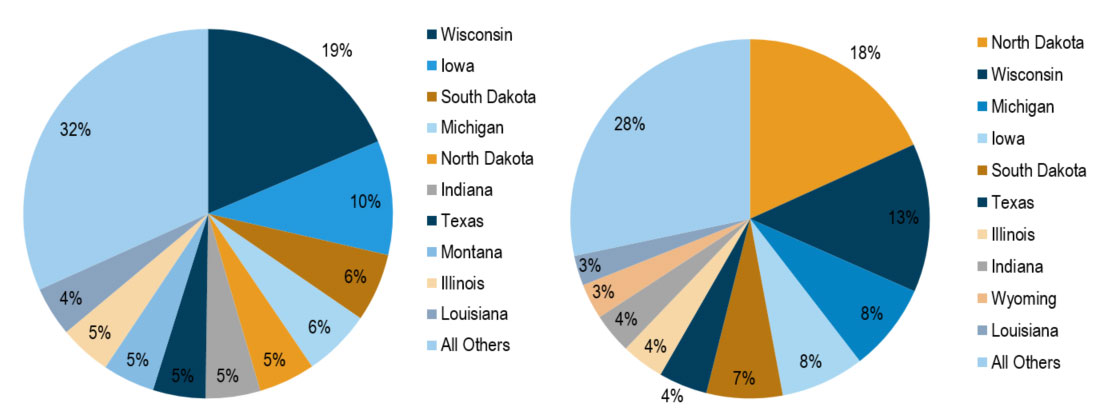
Source: FHWA FAF3 2015 Provisional estimates
Minnesota trades with a variety of foreign nations, particularly Canada; however, international movements are relatively low. Trade with Canada makes up 28 percent of total exports, 41 percent of total imports and 36 percent of overall trade. The proximity of Canada to Minnesota, combined with the numerous ports of entry located on the border between Minnesota and Canada, allow for easy access between markets. Minnesota’s top 10 foreign trading partners based on total imports and exports are shown in Figure 2.7. Each of these countries is in the top 25 for both imports and exports. Other countries not listed here, such as Belgium which is ranked sixth by exports, only represent significant movements in one direction.
Figure 2.7 - Minnesota’s Major Foreign Trading Partners by Total Value, 2013
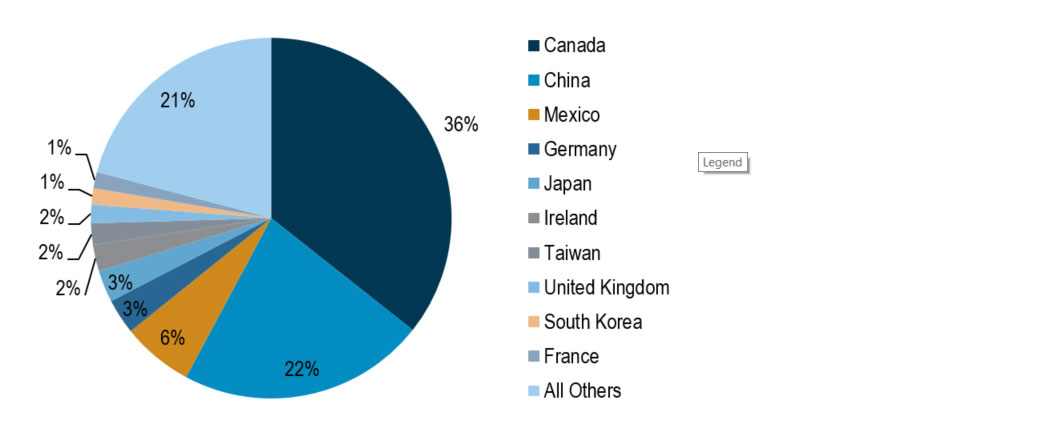
Source: U.S. Census Bureau.
Figure 2.8 details the top locations facilitating trade between Canada and Minnesota based on a combined total value of truck, rail, water, and air movements through gateways both inside and outside of Minnesota. The majority of goods moving between Minnesota and Canada travel through gateways in North Dakota or Michigan. Gateways in the top five states, North Dakota, Michigan, Minnesota, New York and Washington, are conduits for 94 percent of all trade between Canada and Minnesota. Trade through Minnesota’s border crossings makes up about a quarter of the total.
Figure 2.8 - Top Border Crossings for Minnesota-Canada Trade Value ($1,000), 2013
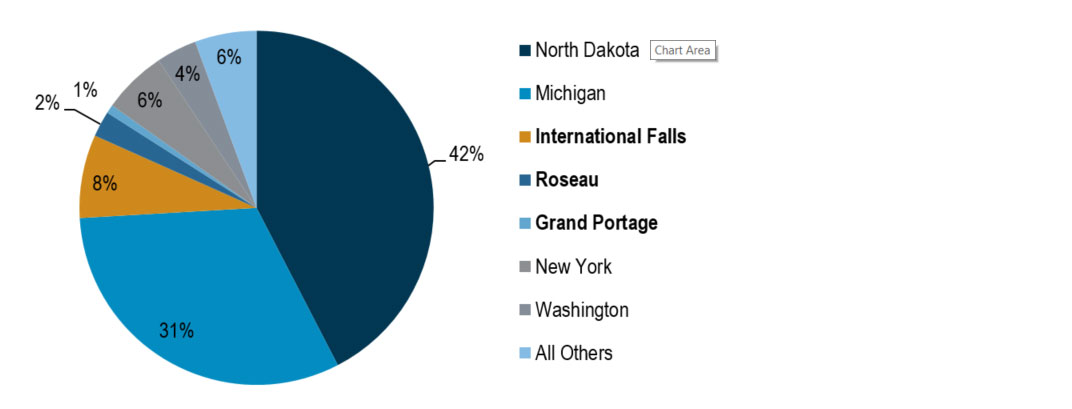
Source: Bureau of Transportation Statistics.
Freight System Demand by Mode
Highway Demand
Trucks are an important mode for moving all types of goods and account for the highest tonnage of goods in Minnesota and nationally. A wide range of commodities is shipped via the highway mode. Even goods shipped primarily using another mode use trucks for last-mile connections to and from their origins and destinations. Cereal Grains, Gravel and Animal Feed reflect the largest tonnages of goods shipped via truck, consistent with the state’s farm culture and raw material production. Looking ahead to 2040, agricultural products are anticipated to require even more use of the state’s highway infrastructure. Table 2.1 details the major commodities anticipated to move over Minnesota’s highway system in 2040. Cereal Grains maintain its position as the highest tonnage commodity moved via truck but lose some of its market share, decreasing from 27 percent to 25 percent. This is due to higher growth seen in other commodities. Animal Feed moves up from the third largest tonnage to second largest, with total tonnage more than doubling from 27.7 million in 2012 to 56 million in 2040. Other Agricultural Products overtake Gravel to round out the top three commodities, fueled by an annual growth of 3 percent.
Table 2.1 - Major Highway Commodities, Total, 2040
| COMMODITY | TONS | PERCENT | RANK CHANGE | TOTAL CHANGE | ANNUAL CHANGE |
|---|---|---|---|---|---|
| Cereal Grains | 159,337,502 | 25% | - | 56% | 2% |
| Animal Feed | 56,369,940 | 9% | +1 | 104% | 3% |
| Other Agricultural Products | 53,667,516 | 8% | +3 | 153% | 3% |
| Gravel | 44,214,491 | 7% | -2 | 21% | 1% |
| Nonmetal Mineral Products | 43,214,491 | 7% | -1 | 68% | 2% |
| Waste/Scrap | 28,309,040 | 4% | -1 | 32% | 1% |
| Other Foodstuffs | 26,844,150 | 4% | - | 79% | 2% |
| Milled Grain Products | 18,761,563 | 3% | +6 | 188% | 4% |
| Live Animals/Fish | 14,596,918 | 2% | +9 | 173% | 4% |
| Coal-n.e.c. | 14,361,904 | 2% | -2 | 2% | 0% |
| Mixed Freight | 13,835,631 | 2% | +6 | 136% | 3% |
| Gasoline | 13,174,338 | 2% | -3 | 9% | 0% |
| Machinery | 10,999,433 | 2% | +9 | 168% | 4% |
| Natural Sands | 10,898,664 | 2% | +2 | 83% | 2% |
| Wood Products | 10,563,900 | 2% | -5 | 21% | 1% |
| All Others | 121,564,450 | 19% |
Source: FHWA FAF3 2015 Provisional estimates
MnDOT District tonnages for the highway system were also reviewed. Total tonnage movements were divided between inbound, outbound and intra-district tonnages and do not include through movements. This data, shown in Figure 2.9, reflects the volume of commodities moving by truck that are produced and consumed in each district.
Figure 2.9 - Truck Freight Flows by Direction, Tons, by District, 2012
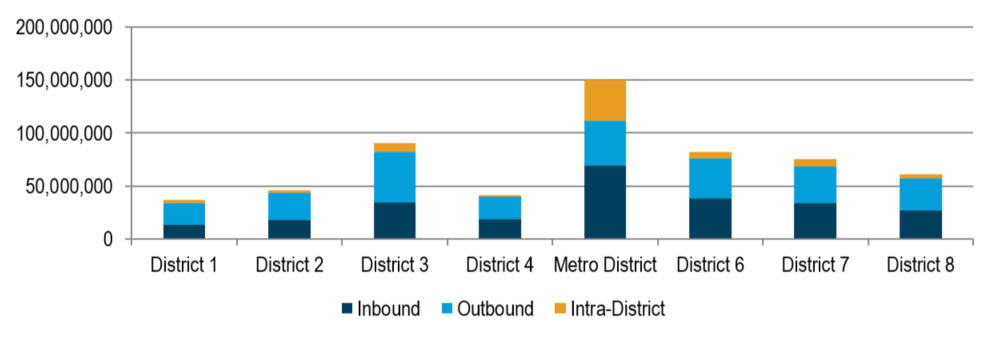
Source: FHWA FAF3 2015 Provisional estimates, disaggregated by Cambridge Systematics.
Rail Demand
The railway network in Minnesota is comprised of 21 rail operators serving passenger and freight traffic. Four of the seven Class I railroads maintain operations within the state: BNSF, Union Pacific (UP), Canadian National (CN), and Canadian Pacific (CP). There are also 17 regional, short line, terminal, and switching railroads in the state. Minnesota’s rail system has some of the highest volumes in the nation, and these flows are projected to continue to grow through 2040. Table 2.2 presents the tons and units carried by class of railroad in Minnesota. In 2012, traffic originating, terminating, or going through Minnesota’s Class I railroads accounted for 251 million tons carried in 3.9 million rail units—99 percent of the state’s rail volume. Traffic on the short lines accounted for 1 percent (2.9 million tons carried in 24,000 rail units). By 2040, the Class I traffic is projected to grow faster than the short line traffic, accounting for 99 percent of the tonnage and rail units.
Table 2.2 - Rail Freight Volumes by Minnesota Railroad (2012-2040, in Thousands)
| RAILROAD CLASS | TONS 2012 | TONS 2040 | %CHANGE 2012-2040 | UNITS 2012 | UNITS 2040 | %CHANGE 2012-2040 |
|---|---|---|---|---|---|---|
| Class I | 251,349 | 460,613 | 83% | 3,898 | 8,106 | 108% |
| Short Line | 2,867 | 5,051 | 76% | 24 | 38 | 56% |
| Total | 252,591 | 463,426 | 83% | 3,904 | 8,118 | 108% |
Source: 2015 Minnesota State Rail Plan, STB 2012 Confidential Carload Waybill Sample and FHWA FAF 3.5 forecast for 2040 processed by Cambridge Systematics.
Note: Numbers do no add up to the totals because there is tonnage that can go on both Class I railroads and Short Line railroads.
Figure 2.10 and Figure 2.11 show current and future rail system volumes. In 2012, 93 percent of tonnage (234 million tons) was carried in railcars, and 7 percent (19 million tons) was carried in intermodal equipment (containers and trailers). When measured in units of railcars and intermodal equipment, in 2012 65 percent (2.5 million units) were railcars and 35 percent (1.4 million units) were intermodal equipment. Rail intermodal volume growth is expected to continue to outpace rail carload growth through 2040, with intermodal tonnage increasing to 10 percent and units to 45 percent of all traffic.
Figure 2.10 - Total Rail Tonnage by Equipment Type, 2012 (left) and 2040 (right)
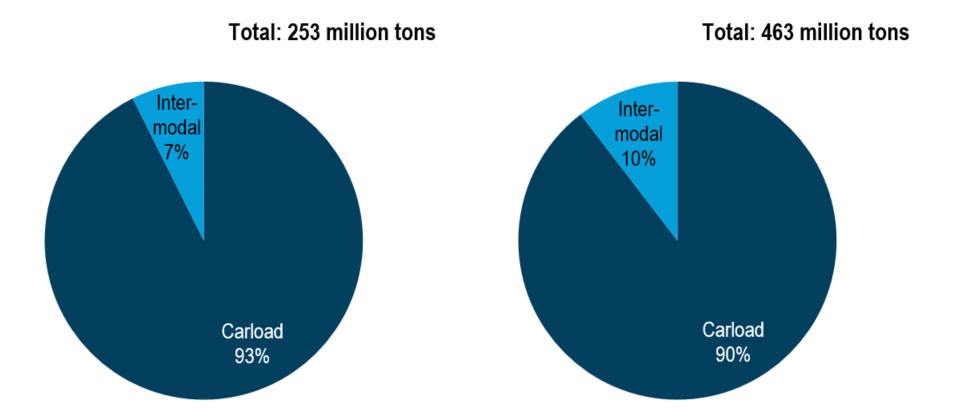
Source:2016 Minnesota State Rail Plan, STB 2012 Confidential Carload Waybill Sample and FHWA FAF 3.5 forecast for 2040 processed by Cambridge Systematics.
Figure 2.11 - Total Rail Units by Equipment Type, 2012 (left) and 2040 (right)
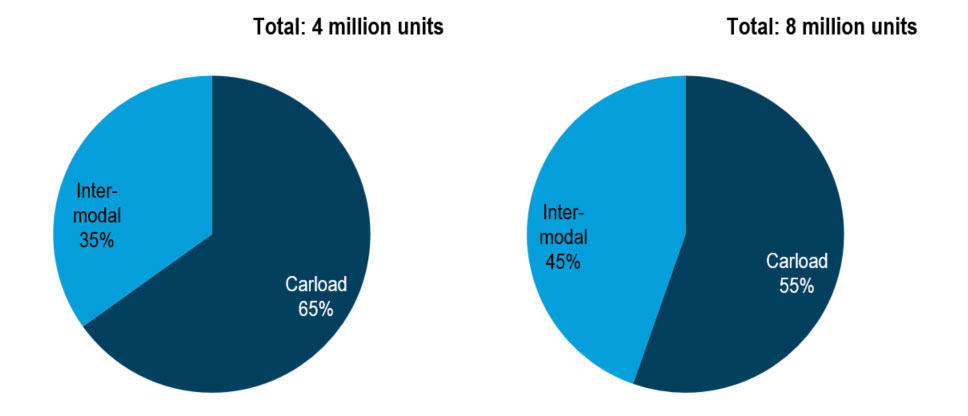
Source: 2016 Minnesota State Rail Plan, STB 2012 Confidential Carload Waybill Sample and FHWA FAF 3.5 forecast for 2040 processed by Cambridge Systematics.
Fewer products move over the railway network than the highway network, and fewer goods make up a larger percentage of overall tonnage. Table 2.3 details the major commodities moving over this system. Metallic Ores, Cereal Grains, and Coal are the three largest commodities moved via this mode. Representing 62 percent of the total tonnage moved by rail, these commodities are critical for maintaining a competitive rail service in the state. Pass-through rail movements are not included.
These three commodities are not projected to have high growth through 2040. While Cereal Grains are anticipated to grow at a rate of 4 percent annually, volumes for both Metallic Ores and Coal are expected to decrease slightly. Other commodities, such as Basic Chemicals and Nonmetallic Minerals, are anticipated to fill some of the void left by these commodities.
Table 2.3 - Major Railroad Commodities, Total, 2040
| COMMODITY | TONS | PERCENT | RANK CHANGE (2012-2040) | TOTAL CHANGE | ANNUAL CHANGE |
|---|---|---|---|---|---|
| Cereal Grains | 89,294,595 | 25% | - | 56% | 2% |
| Animal Feed | 56,369,940 | 9% | +1 | 104% | 3% |
| Other Agricultural Products | 53,667,516 | 8% | +3 | 153% | 3% |
| Gravel | 44,214,491 | 37% | +1 | 232% | 4% |
| Metallic Ores | 30,782,670 | 13% | -1 | 4% | 0% |
| Coal | 17,805,883 | 7% | - | -6% | 0% |
| Basic Chemicals | 15,411,006 | 6% | +3 | 355% | 6% |
| Fertilizers | 10,167,477 | 4% | - | 84% | 2% |
| Other Agricultural Products | 8,303,144 | 3% | +3 | 159% | 3% |
| Coal-n.e.c. | 7,698,022 | 3% | +5 | 159% | 3% |
| Nonmetallic Minerals | 6,578,648 | 3% | +5 | 255% | 5% |
| Animal Feed | 5,918,011 | 2% | +1 | 87% | 2% |
| Wood Products | 5,918,011 | 2% | -6 | 4% | 0% |
| All Others | 43,575,765 | 18% |
Source: FHWA FAF3 2015 Provisional estimates
Port and Waterway Demand
Minnesota has access to the Great Lakes and Mississippi River systems. The state has eight ports: four along the Mississippi River System and four on Lake Superior. Commodities shipped via waterways are usually lower value, bulk materials. This is evident in the types of commodities shipped via Minnesota’s waterways, detailed in Table 2.4. The largest commodity by tonnage is Iron Ore, Iron, and Steel Waste and Scrap at 68 percent of overall tonnage, and a majority of this is comprised of taconite shipping on the Great Lakes. Food and Foods Products are also among the top three commodities shipped via this mode, consistent with both highway and railway movements.
Table 2.4 - Major Waterway Commodities, Total, 2012
| TOTAL | TONS | PERCENT |
|---|---|---|
| Iron Ore, Iron, and Steel Waste and Scrap | 29,431,604 | 68% |
| Unknown and Not Elsewhere Classified | 4,912,147 | 11% |
| Food and Food Products | 4,448,456 | 10% |
| Sand, Gravel, Shells, Clay, Salt, and Slag | 2,416,665 | 6% |
| Chemical Fertilizers | 1,633,038 | 4% |
| Primary Non-Metal Products | 129,223 | <1% |
| Chemical Excluding Fertilizers | 106,413 | <1% |
| Primary Metal Products | 86,120 | <1% |
| Lumber, Logs, Wood Chips and Pulp | 71,352 | <1% |
| Manufactured Goods | 10,854 | <1% |
| Petroleum Products | 19 | <1% |
Source: U.S. Army Corps of Engineers Waterborne Commerce Data, 2012.
Air Cargo Demand
Air movements account for the lowest tonnage volumes in the state among the transportation modes. However, the commodities shipped via air are typically low weight but high value goods. As with waterway movements, the Freight Analysis Framework does not accurately reflect the magnitude of air movements. In this case there are no additional data sources that detail the types of commodities moved via air.
Most air cargo in Minnesota moves through the Minneapolis-St. Paul International Airport, although other airports in the state do ship and receive smaller volumes of air cargo. The percentage of total tonnage of each commodity was derived from FAF and scaled to the appropriate tonnage level as reported by the Minnesota airports. From this, it can be determined that Electronics, Precision Instruments and Machinery are the dominant commodities moved via this mode, accounting for 62 percent of total tonnage.
To produce 2040 forecasts, data was scaled using the same methodology. In examining the results, the three dominant commodities moved via air today will be the largest contributors in 2040 as seen in Table 2.5. Each of these products is anticipated to at least double in tonnage, with Precision Instruments quadrupling, resulting in this commodity overtaking Electronics as the highest tonnage. Other products with significant growth are in the chemical industry with an 11 percent annual growth in Basic Chemicals and a 5 percent annual growth of Chemical Products.
Table 2.5 - Major Air Commodities, Total, 2040
| COMMODITY | TONS | PERCENT | RANK CHANGE (2012-2040) | TOTAL CHANGE | ANNUAL CHANGE |
|---|---|---|---|---|---|
| Precision Instruments | 202,395 | 31% | +1 | 697% | 8% |
| Electronics | 134,068 | 21% | -1 | 125% | 3% |
| Machinery | 65,260 | 10% | - | 268% | 5% |
| Chemical Products | 37,974 | 6% | +3 | 327% | 5% |
| Miscellaneous Manufacturing Products | 35,808 | 5% | -1 | 224% | 4% |
| Basic Chemicals | 31,135 | 5% | +12 | 1623% | 11% |
| Articles-Base Metal | 19,081 | 3% | +4 | 193% | 4% |
| Plastics/Rubber | 18,661 | 3% | +4 | 190% | 4% |
| Motorized Vehicles | 14,749 | 2% | -1 | 74% | 2% |
| Mixed Freight | 14,105 | 2% | -1 | 79% | 2% |
| All Others | 79,142 | 12% |
Source: FHWA FAF3 2015 Provisional estimates, Minneapolis – St. Paul International Airport Year End Operations Reports (2008-2013), Minnesota State Aviation System Plan.
Pipeline Demand
Due to the very nature of the pipeline infrastructure, only limited commodities can be shipped via this mode. The Freight Analysis Framework details four commodities moving via Minnesota’s pipeline network, as seen in Table 2.6. At 52 percent, Coal-n.e.c. is the dominant commodity using this mode. The Coal-n.e.c category represents natural gas, selected coal products and products of petroleum refining, excluding gasoline, aviation fuel and fuel oil. Crude Petroleum and Gasoline have a relatively equal share at 22 percent and 18 percent, respectively.
By 2040, the total tonnage moved via this mode is anticipated to roughly double as seen in Table 2.6. Coal – n.e.c. and Crude Petroleum are anticipated to increase at a rate of 3 percent per year, resulting in the tonnages of these commodities to more than double. On the other hand, Gasoline and Fuel Oils are expected to decrease at a rate of 1 percent per year, reducing total tonnage by 20 percent and 17 percent, respectively. Due to the decrease in these commodities, Coal-n.e.c. will increase its share of tonnage via this mode from 52 percent to 63 percent.
Table 2.6 - Major Pipeline Commodities, Total, 2040
| COMMODITY | TONS | PERCENT | RANK CHANGE (2012-2040) | TOTAL CHANGE | ANNUAL CHANGE |
|---|---|---|---|---|---|
| Coal-n.e.c. | 64,674,269 | 63% | - | 117% | 3% |
| Crude Petroleum | 26,447,999 | 26% | - | 109% | 3% |
| Gasoline | 8,386,049 | 8% | - | -20% | -1% |
| Fuel Oils | 3,552,178 | 3% | - | -17% | -1% |
Source: FHWA FAF3 2015 Provisional estimates.
Note: Coal-n.e.c. refers to coal and petroleum products not elsewhere classified, including natural gas.
Minnesota’s Designated Principal Freight Network
Minnesota’s Principal Freight Network was designated as part of developing this plan for several reasons:
- MAP-21 Transportation Legislation. MAP-21 required the U.S. DOT to designate a highway Primary Freight Network consisting of up to 27,000 miles on existing interstate and other roadways. The U.S. DOT Primary Freight Network helps states strategically direct resources toward improving freight movement; however, the network designated in Minnesota was not a holistic representation of the state’s priority system.
- Need to knit together MnDOT “freight” networks. MnDOT has formally and informally designated several networks that have potential overlap with what this plan defines as Minnesota’s Principal Freight Network, such as the Twin-Trailer Network, the 10-ton network and an over-dimensional freight network, to name a few. These networks complement one another and their roles as they relate to the Minnesota Principal Freight Network have been clarified.
- Need for a multimodal system. The U.S. DOT’s Primary Freight Network is centered on the highway system, the traditional focus of state transportation planning and programming. However, Minnesota’s freight system is multimodal. For supply chains to work efficiently, each component is critical. Key modal components, including the highway system, intermodal hubs and connections to ports/airports, must be acknowledged in the Minnesota Principal Freight Network. Additionally, identifying priority networks was identified as a strategy in the Statewide Multimodal Transportation Plan.
The designation of Minnesota’s Principal Freight Network, a data–driven process, was guided by a Freight Network Ad Hoc Working Group with additional input received from other public and private stakeholders and the Minnesota Freight Advisory Committee. The designation process is detailed in a supplemental Technical Memo – Minnesota’s Principal Freight Network.
Shown in Figure 2.12, the collaborative approach resulted in designation of Minnesota’s Principal Freight Network that includes the following:
- Highway System – more than 5,200 miles
- Rail Corridors – 2,080 miles
- Rail Facilities – seven terminals
- Waterway Corridors – one Great Lakes corridor and two Inland Waterway corridors
- Waterway Ports –four Great Lakes ports and four inland waterway ports
- Airports – five airports
- Pipeline Facilities – two refineries and six refined asset terminals
This multifaceted network highlights the principal components of each modal system and the points of multimodal/intermodal connectivity. This network links to industries and provides access throughout Minnesota, the Upper Midwest, nationally and to key international import/export ports.
Figure 2.12 - Minnesota's Principal Freight Network
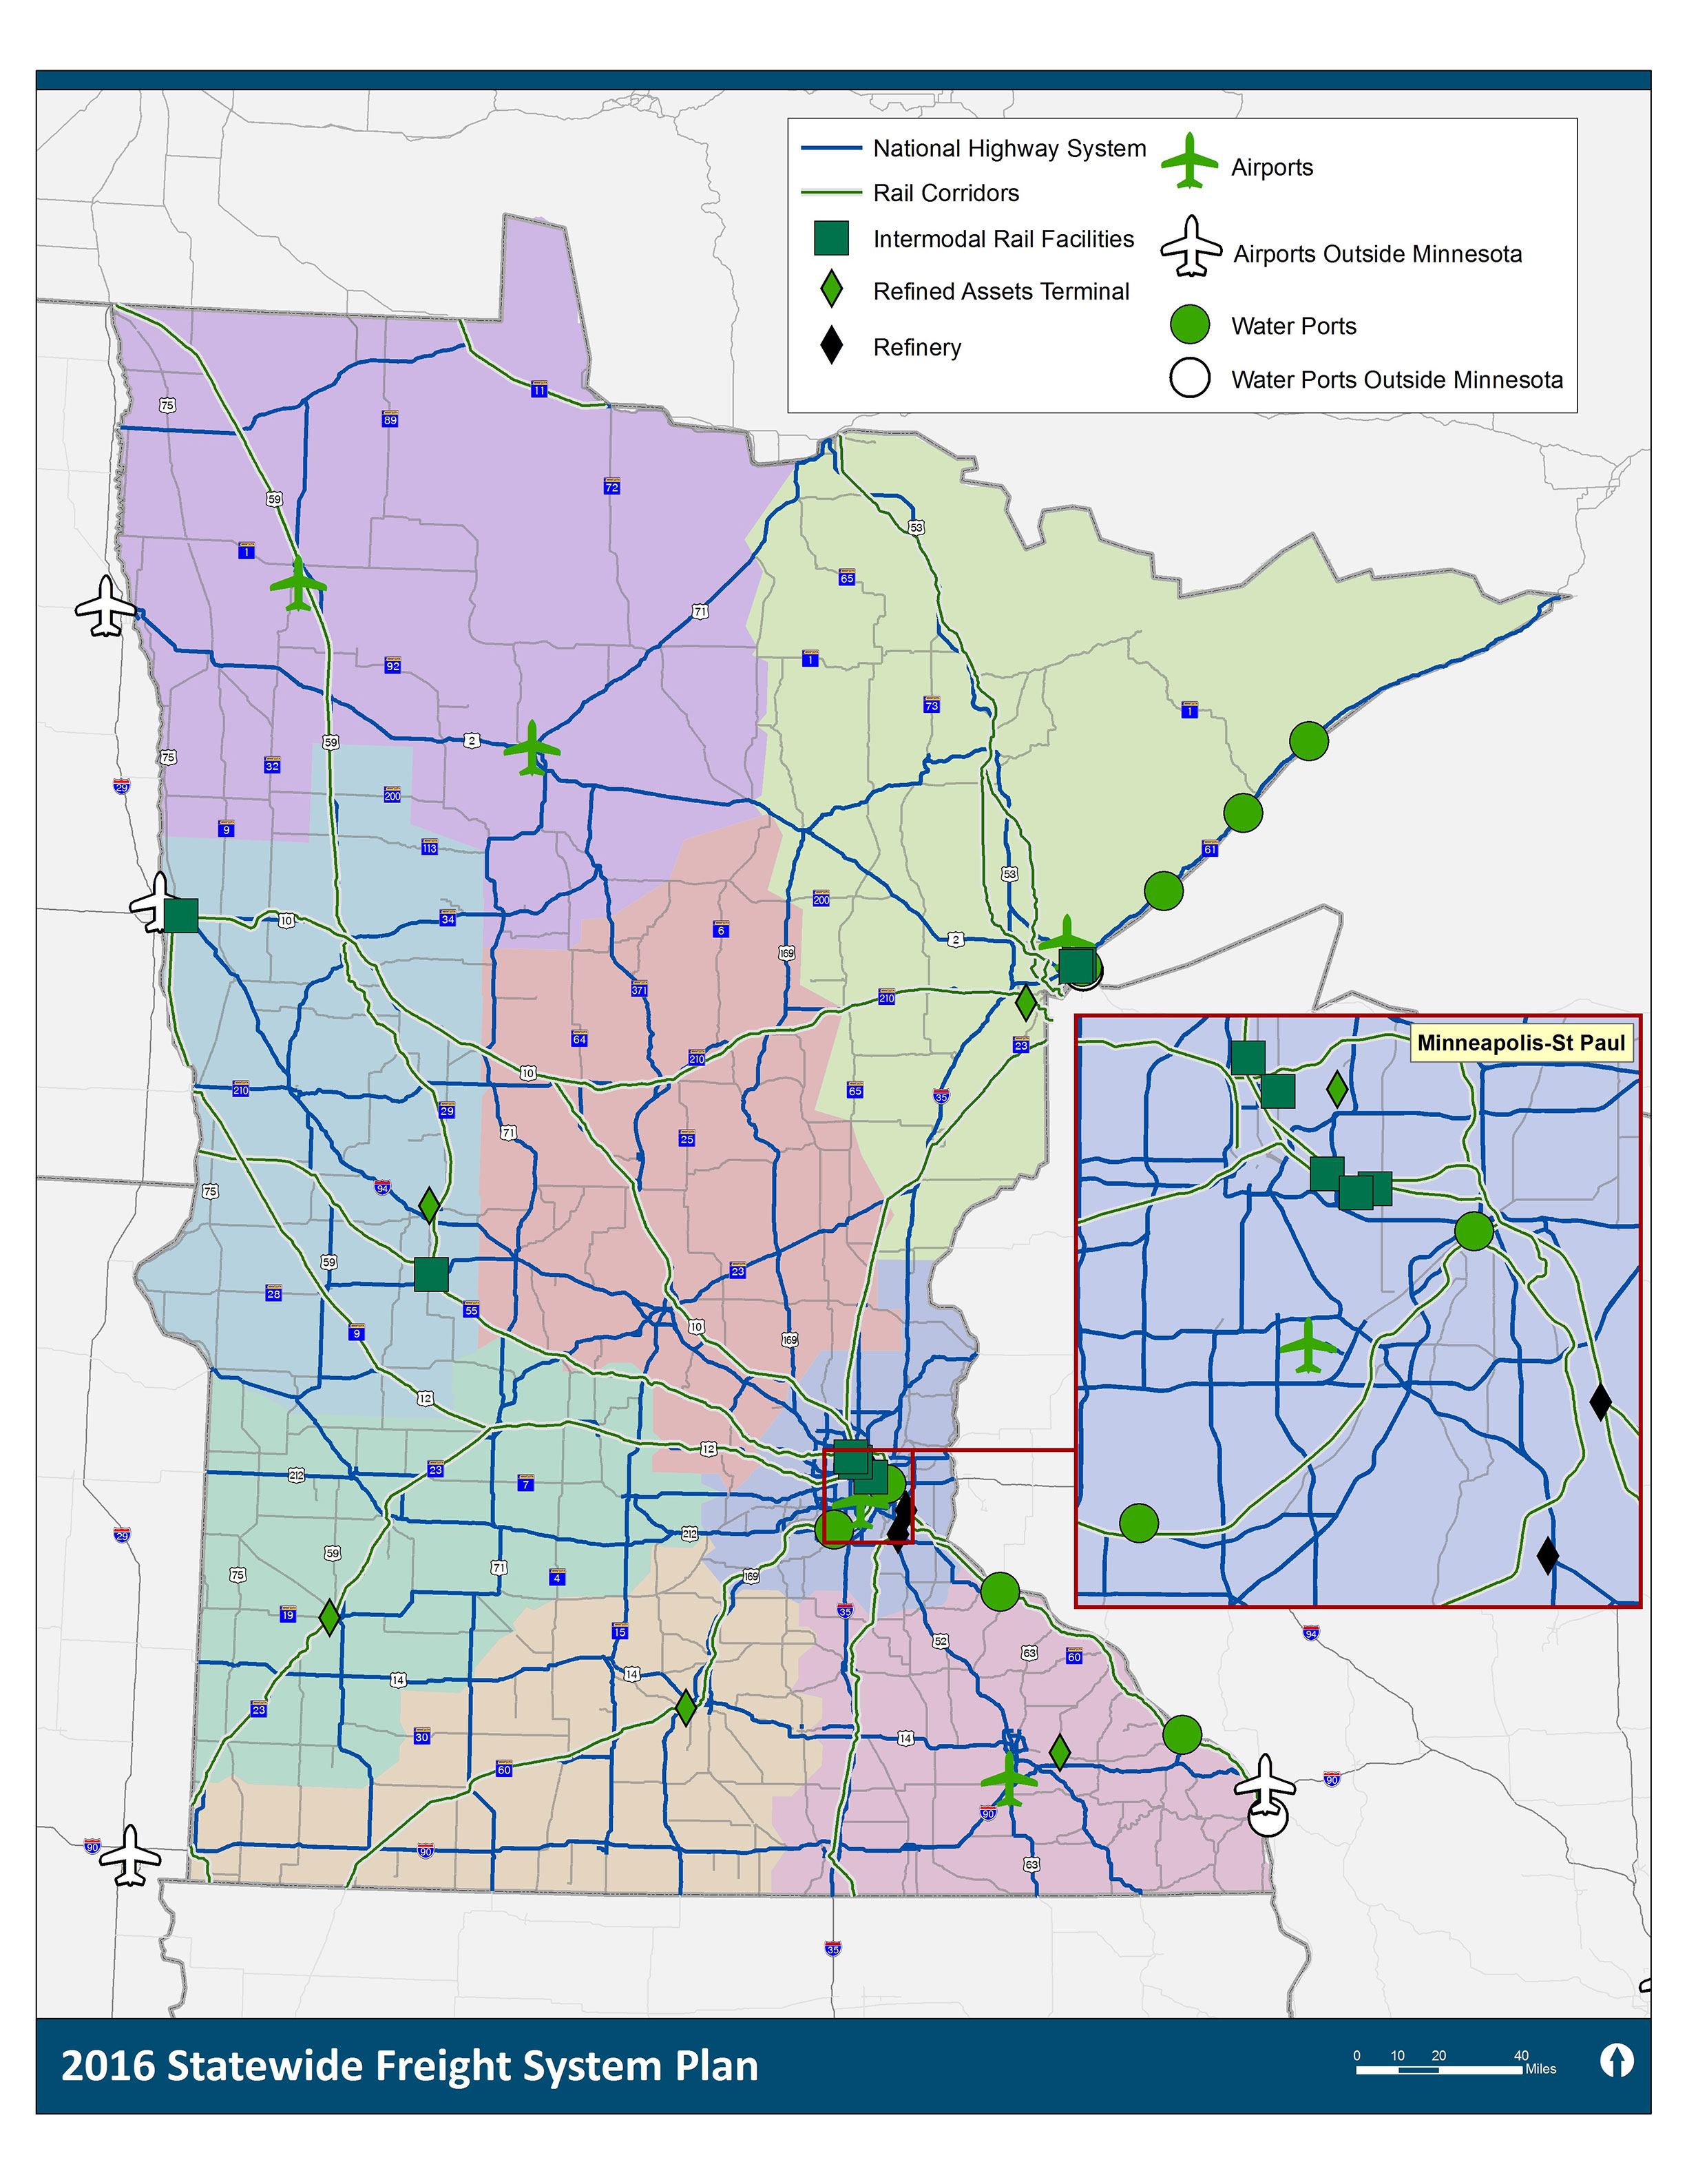
Note: Map does not reflect changes to the National Highway System (NHS) resulting from the 2014-2015 greater Minnesota functional classification review
1 Minnesota Pipe Line, http://www.minnesotapipeline.com/
2 The Coal-n.e.c category represents natural gas, selected coal products, and products of petroleum refining, excluding gasoline, aviation fuel and fuel oil.
3 http://www.farmandranchguide.com/news/crop/prospective-plantings-report-yields-no-big-surprises-for-cereal-grains/article_d4b9f6c4-b9e9-11e3-867e-001a4bcf887a.html