
Chapter 2 – Where are we now?
Minnesota at a Glance
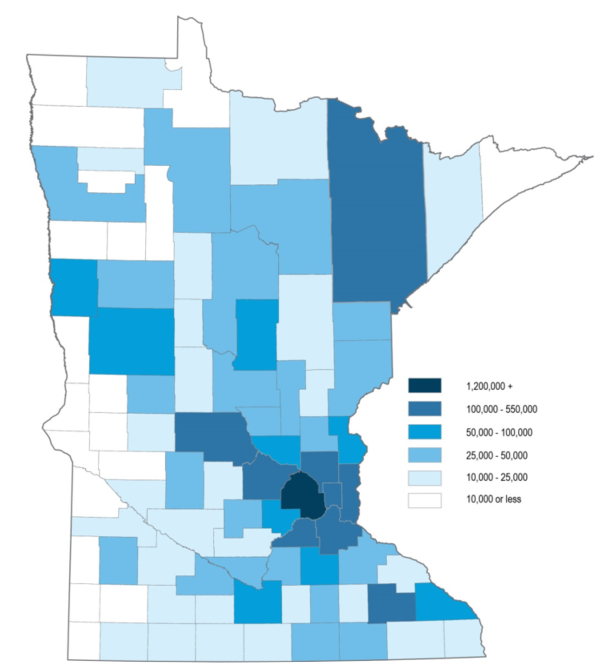
Minnesota’s quality of life and economic well-being rely on an efficient and reliable transportation system. The system connects businesses to suppliers and customers near and far. The system also allows people to get to their jobs and schools, see the doctor and take advantage of the state’s many cultural, entertainment and recreational opportunities. Minnesota and the state’s transportation system have great strengths but there are also challenges. Identifying where the state is today can help make better plans for the future. Table 2-1 highlights key characteristics of Minnesota. Figure 2-1 shows Minnesota's population by county.
Table 2-1: Minnesota at a glance, 2016
| Characteristic | Current Status |
|---|---|
| Population | 5,489,594 (21st largest) |
| State Area | 86,939 sq. mi. (12th largest) |
| Population Density | 67.1 people / sq. mi. (31st highest) |
| Median Household Income | $58,906 (9th highest) |
| Median Household Size | 2.48 people |
| Largest City (by population) | Minneapolis (407,207) |
| Largest County (by population) | Hennepin County (1.2 million) |
| Largest County (by area) | St. Louis County (6,225 sq. mi.) |
| Gross State Product[1] | $317.24 billion (16th highest) |
| Largest Industries (by Gross State Product)[2] | 1. Financial Services 2. Manufacturing 3. Professional and Business |
| Biomes[3] |
|
| Lakes (10+ acres in size)[4] | 11,842 |
Figure 2-1: Minnesota population by county, 2015
Existing Transportation System
Minnesota has a vast multimodal transportation system that includes roads, rail lines, airports, ports, waterways, pipelines, transit systems, trails, paths, sidewalks, and more. MnDOT and local, regional, state, tribal, federal, private sector, and non-profit partners keep the system running. Table 2-2 highlights key characteristics of the transportation system in Minnesota.
The following sections provide more detail on the background, use and performance of each part of the system.
Table 2-2: Snapshot of Minnesota’s transportation system, January 2017
| Characteristic | Current Status |
|---|---|
| All Streets, Roads and Highways | 142,914 centerline miles |
| State Trunk Highways | 11,814 miles |
| County Roads | 44,821 miles |
| City Streets | 22,414 miles |
| Township Roads | 58,686 miles |
| Other Public Roads | 4,405 miles |
| Sidewalk Miles | 620 miles along state highways, plus thousands more along local roadways |
| National and State Designated Bicycle Routes | 1,133 miles (Mississippi River Trail and North Star Route) |
| Designated Trails | More than 4,000 miles |
| Bicycle Sharing | One provider (Nice Ride MN) operating in Minneapolis and St. Paul; other informal systems in communities statewide |
| Twin Cities Transit | 212 bus routes (110 local routes, 102 express routes), two light rail transit lines, one highway bus rapid transit route, one arterial bus rapid transit route and dial-a-ride service |
| Greater Minnesota Transit | 76 of 80 (non-Twin Cities) counties with county-wide transit service, four counties with municipal service only, seven fixed-route systems and seven small urban systems |
| Intercity Bus | 87 destinations served in the state as well as connections to every metropolitan area in the Midwest |
| Freight Rail | 4,485 track miles served by 21 railroad companies |
| Commuter Rail (see transit above for light rail) | Northstar commuter rail line (Big Lake to Minneapolis) |
| Intercity Passenger Rail | Amtrak Empire Builder (Chicago to Seattle) |
| Airports | 388 airports in Minnesota, including 135 public airports, nine with commercial airline service |
| Great Lakes Ports | Four ports on Lake Superior |
| River Ports | Four public ports on 219 miles of the Mississippi River system (including the Minnesota and St. Croix rivers) |
| Pipelines | 9,347 miles |
| Carsharing | Two systems (HOURCAR and Zipcar) operating in Minneapolis, St. Paul, Winona and Mankato |
| Ride-hailing | Many local taxi companies, along with emerging ride-hailing companies like Lyft and Uber |
Streets, Roads & Highways
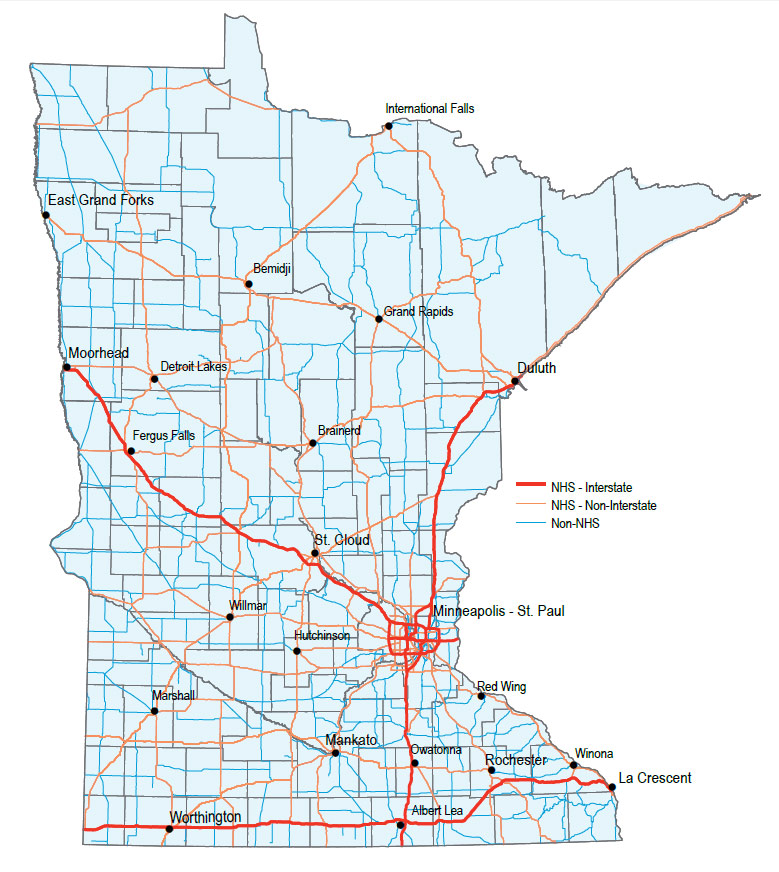
Minnesota has the fifth largest system of roads in the country. As a whole, the state’s network is made up of 142,914 miles of public roadways across state, county, and municipal systems. For context, the state ranks 21st in population and 12th in geographic size. Figure 2-2 shows the existing state highway network. This network is the backbone of Minnesota's roadway system. It includes those roads designated as part of the National Highway System and other state roads. The state highway network is approximately 8 percent of all roadways in Minnesota.
Figure 2-2: Minnesota’s state highway network
Minnesota’s roadway network changed over time to meet the needs of those who use it. Total growth in vehicle miles travels leveled off in 2004 after decades of rising faster than population growth (see Figure 2-3). The total miles traveled by vehicles in the state remained virtually unchanged from 2004 until 2014. Statewide, vehicle miles traveled grew by 3 percent from 2014 to 2015. This growth rate is significantly more than previous years, but is less than the national rate.[5] Figure 2-4 shows how vehicle miles traveled are distributed on the system. All transportation partners need to continue to monitor changes in vehicle miles traveled over time to determine what the long-term trend will be.
Figure 2-3: Vehicle miles traveled in Minnesota
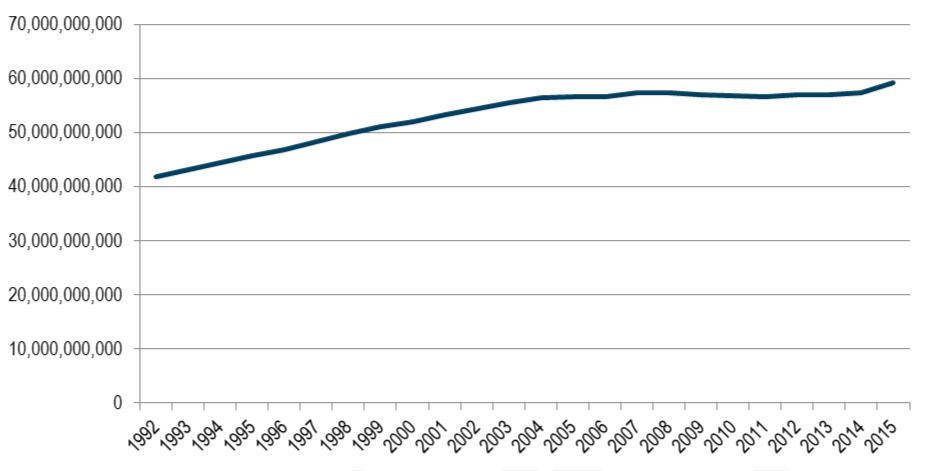
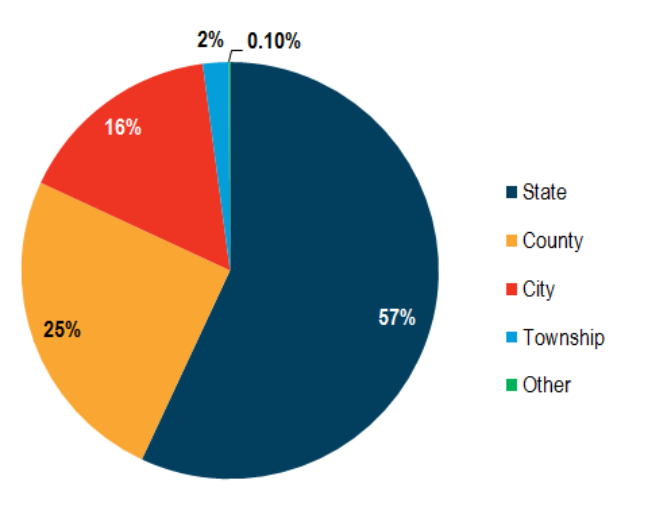
Figure 2-4: Percentage of vehicle miles traveled by roadway system, 2015
Faced with an extensive, rapidly aging system and increasing construction costs statewide, transportation partners in Minnesota are struggling to keep the roadway system in good repair. More than 2 percent of pavements on the interstate system in Minnesota are in poor condition. This is greater than the state’s target of having less than 2 percent of Interstate pavements in poor condition. For the non-interstate National Highway System roadways, currently less than three percent of pavements are in poor condition. This beats the target of less than 4 percent. Similarly, for the non-NHS roadways, approximately 5 percent of pavements are in poor condition. This beats the target of less than 10 percent. Generally, the percentage of pavements in poor condition across all roadway systems is expected to increase in the future.
How does MnDOT Define Poor Pavement?
MnDOT uses performance measures and targets to inform decision-making. One key performance measure is pavement condition. The target for this measure is based on limiting the number of roadway miles in “poor” condition.
Pavement condition is determined through the Ride Quality Index, a measure of roadway smoothness. Poor condition is defined as a pavement surface with a RQI of two or less.
Similar metrics are used for other assets in addition to pavement, such as bridge condition.
Despite improving from 2014 to 2015, MnDOT is not currently meeting the state’s target for percentage of NHS bridges were in poor condition. Three percent of NHS bridges were in poor condition in 2015. The target is less than 2 percent. The percentage of NHS bridges in poor condition is expected to remain steady in the near future. The percentage of non-NHS bridges in poor condition is beating the target of less than 8 percent by a significant margin. Currently, 3.1 percent of non-NHS bridges are in poor condition. Further improvements are expected in coming years.
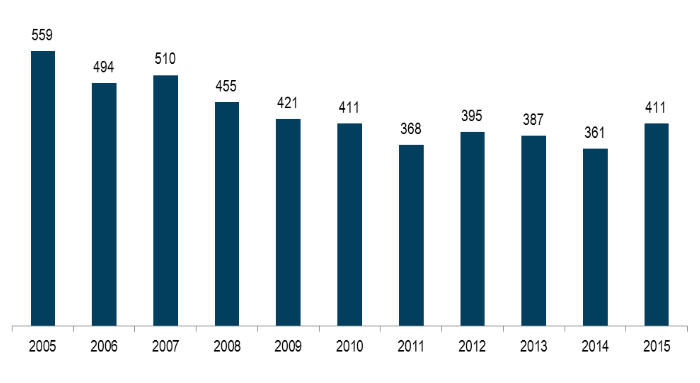
In 2015, Minnesota reached a new five-year high in traffic fatalities after making substantial progress in reducing deaths on the roadway system since 2005. In total, 411 travelers lost their lives due to motor-vehicle crashes in Minnesota during 2015 (Figure 2-5). This includes any crash involving a motor vehicle, including crashes with bicyclists and pedestrians. The number of serious injuries on the system increased from 1,044 in 2014 to 1,127 in 2015. However, the total number of serious injuries remained lower than any other year this decade.
Figure 2-5: Annual traffic fatalities on Minnesota roads, 2005 to 2015
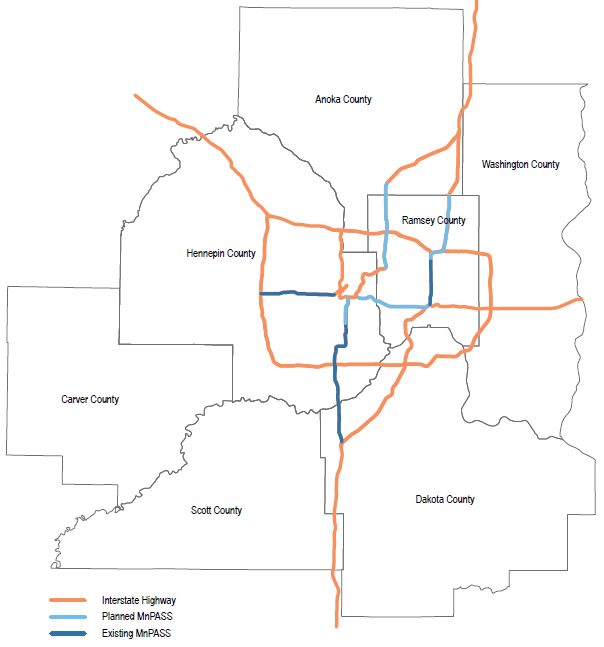
The Twin Cities’ MnPASS Express Lane System continues to expand. MnPASS lanes were first implemented on the Twin Cities’ freeway system in 2005 along I-394. This automated toll lane and other managed lane technologies have since been extended to portions of I-35W and I-35E. These technologies are also under consideration for other parts of the Twin Cities. Figure 2-6 shows the existing and Tier 1 planned MnPASS corridors in the Twin Cities. Additionally, Smart Lanes are operating on segments of I-35W and I-94. These systems use electronic signs above each lane of traffic to improve traffic flow, reduce congestion and improve safety by providing real-time information about road conditions.
Figure 2-6: Existing and Tier 1 planned MnPASS corridors
Congestion in the Twin Cities
There are many ways to think about slow-downs on the roadway system. Delays and congestion can be measured in the amount of time or fuel wasted, cost to travelers, or reductions in access to destinations within a given amount of time. MnDOT keeps detailed data on motor-vehicle congestion in the Twin Cities, and has begun collecting and analyzing travel time reliability data for Greater Minnesota. Currently, MnDOT measures motor-vehicle congestion in the Twin Cities based on travel speed. Despite the inconvenience, stress and other negative side effects of congestion, it is also a sign that local economies are flourishing. Freeway congestion levels in the Twin Cities have remained relatively constant since the mid-2000s, with a little more than 20 percent of freeway miles congested during peak travel periods. There was an increase in freeway congestion in 2015. It is unclear at this time whether this represents a longer-term trend of increasing freeway congestion.
Figure 2-7: Percentage of freeway miles in the Twin Cities operating below 45 MPH during peak periods, 2005 to 2015
Bicycling & Walking
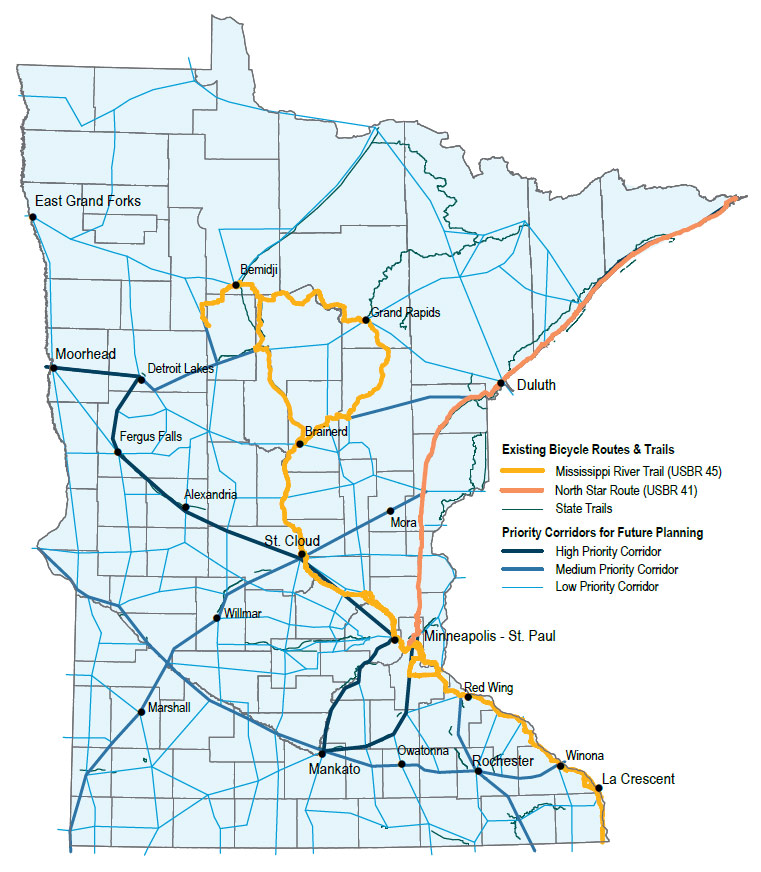
For bicycling and walking, local connections are often more important than long-distance connections since most trips occur within communities. However, at the state level, Minnesota currently has two designated U.S. Bicycle Routes – the Mississippi River Trail and the North Star Route. These routes include 1,133 miles of designated bicycle facilities on state and local roads as well as trails. Additionally, there are more than 4,000 miles of trails for bicycling and walking in the state. Figure 2-8 highlights existing state trails and priority bicycle corridors that MnDOT will consider for infrastructure improvements and future designation as state bicycle routes. There are also many, many more on-road infrastructure facilities that support bicycling and walking. Examples of on-road bicycle and pedestrian facilities include bicycle lanes, shared use paths, sidewalks and widened or paved shoulders.
Rates of bicycling and walking increased in the Twin Cities from 2001 to 2010.[6] Overall, 2 percent of trips in the Twin Cities are completed by bicycle and 6 percent are completed on foot.[7] In Minneapolis, the number of regular bicycle commuters roughly tripled in 15 years, from almost 4,000 in 2000 to almost 12,000 in 2015.[8] MnDOT is currently developing a network of index counting locations to better understand trends in bicycling and walking in Greater Minnesota.
From 2006 to 2015, there was an average of 876 pedestrian and 922 bicycle crashes per year. Although overall motor vehicle fatalities and serious injuries decreased over the past 10 years, fatalities and serious injuries involving bicyclists and pedestrians remained relatively unchanged. In 2006, 38 pedestrians and eight bicyclists lost their lives on Minnesota roadways. In 2015, 41 pedestrians and 10 bicyclists were killed as a result of crashes with motor vehicles.
Figure 2-8: Minnesota’s designated state trails & priority future bicycle corridors
Public Transit in the Twin Cities
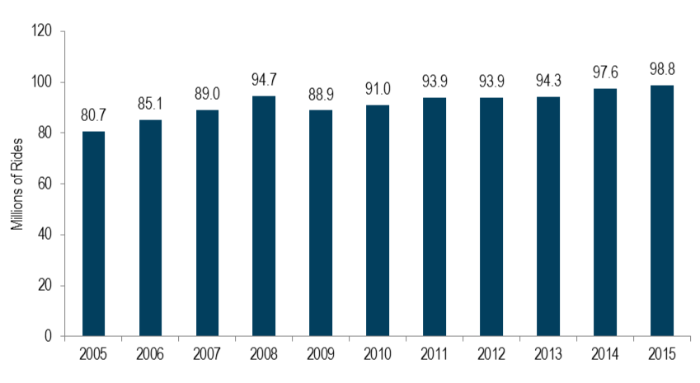
A variety of public transit options are available in the Twin Cities. Current options include regular and express bus routes, light rail transit, commuter rail, and bus rapid transit. Dial-a-ride service is also available throughout the region. All 187 cities and townships in the seven-county metro have access to some form of public transit service. Between 2005 and 2015, transit ridership in the Twin Cities grew by nearly 25 percent. Total ridership was 98.8 million in 2015. Figure 2-9 shows where fixed-route public transit is available in the Twin Cities in addition to planned transitway corridors under development. Figure 2-10 shows total transit ridership since 2005.
Figure 2-9: Existing and planned Twin Cities’ fixed-route public transit
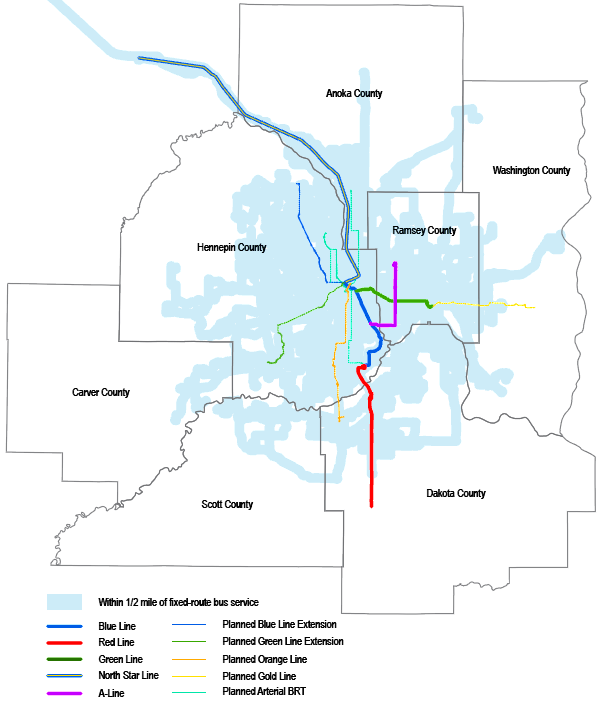
Figure 2-10: Twin Cities transit ridership, 2005 to 2015
Public Transit in Greater Minnesota
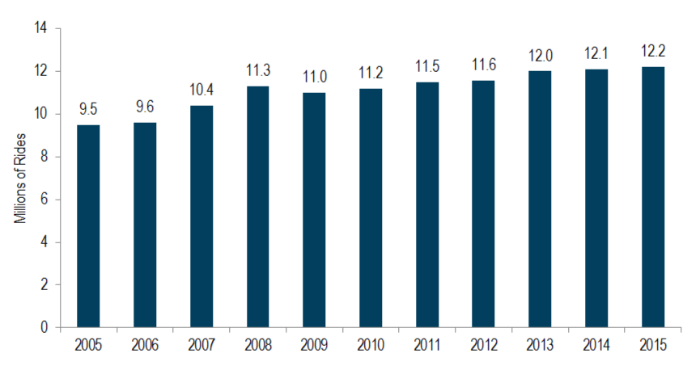
Seventy-six out of the 80 counties in Greater Minnesota have county-level transit service. The remaining four counties have service within one or more cities, but not at the county-level. Additionally, there are seven fixed-route systems in Greater Minnesota’s metropolitan areas, seven small urban systems and four systems operated by tribal nations. Figure 2-11 shows public transit service in Greater Minnesota. Between 2005 and 2015, ridership increased by more than 25 percent across Greater Minnesota. In 2015, total transit ridership was at a 10-year high of 12.2 million, as shown in Figure 2-12.
Figure 2-11: Greater Minnesota transit service
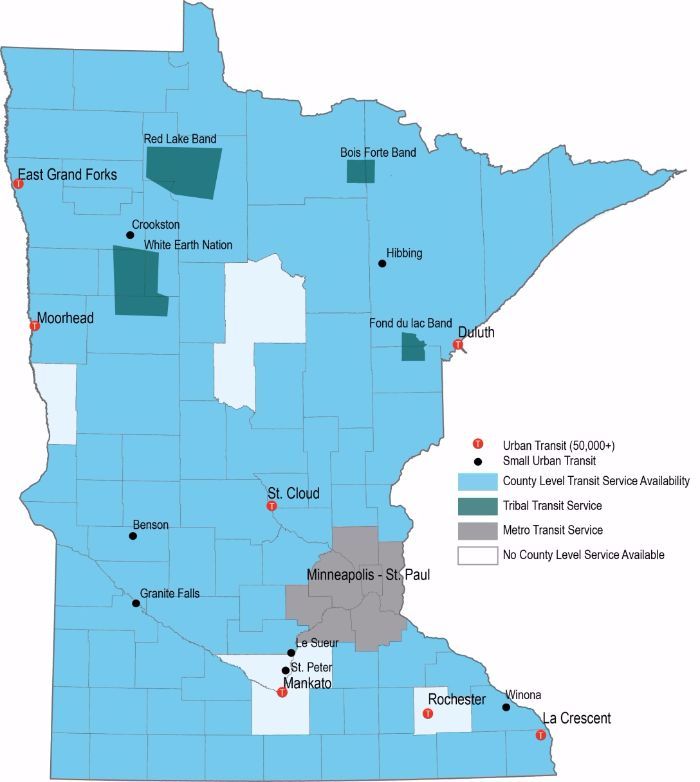
Figure 2-12: Greater Minnesota transit ridership, 2005 to 2015
Intercity Bus & Rail Passenger Services
Minnesota has intercity passenger rail and bus service. Greyhound, Jefferson Lines, Land to Air Express, Northfield Lines, Rainbow Rider and Megabus provide intercity bus service to 87 destinations across the state. These services also connect to every major metropolitan area in the Midwest. Minnesotans took 49,801 rides on intercity bus routes in 2015.
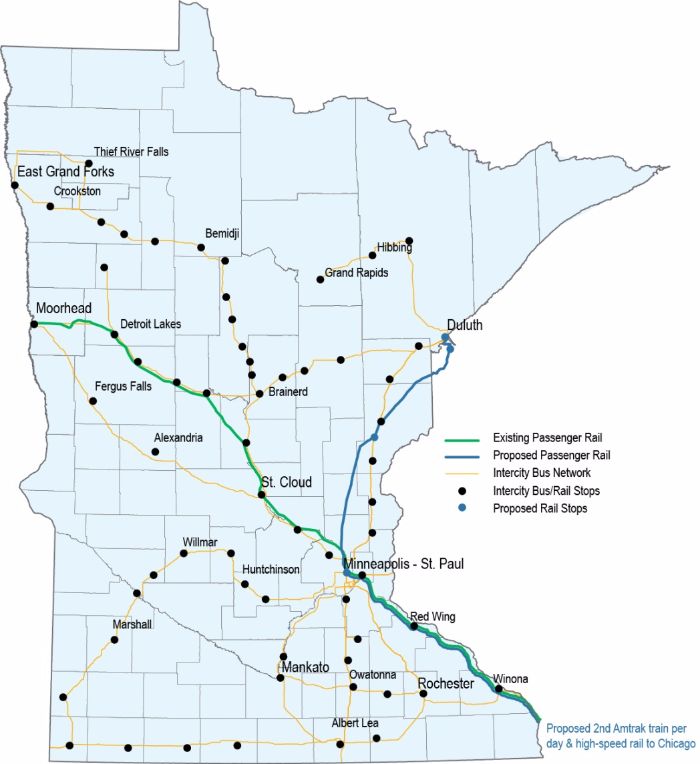
Amtrak’s Empire Builder route offers passenger rail service between Chicago and Seattle, stopping at stations in six Minnesota cities (Detroit Lakes, Staples, Saint Cloud, Saint Paul-Minneapolis, Red Wing and Winona). Additional corridors are being considered for future passenger rail service. Figure 2-13 shows the existing and planned intercity passenger rail corridors and intercity bus network in Minnesota.
Figure 2-13: Minnesota’s existing and planned intercity passenger rail corridors and existing intercity bus network
Freight Rail
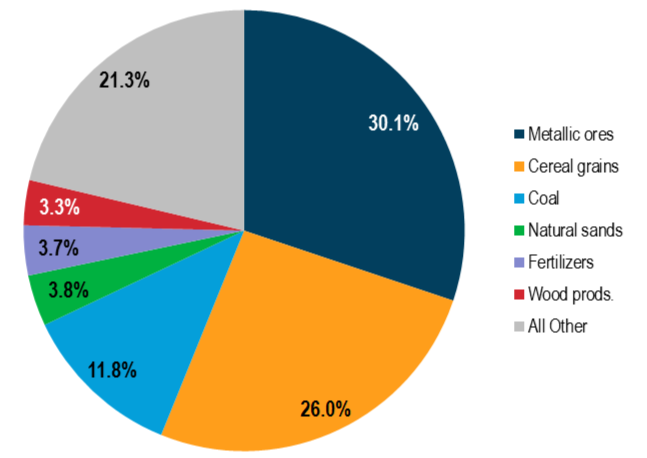
As of 2015, there were 21 railroad companies operating in Minnesota on 4,485 route miles of track. The state ranks eighth in total track mileage. The main products shipped on Minnesota’s freight rail system are metallic ores, cereal grains and other food products. Minnesota ranks first in the nation in tons of iron ore shipped, third in food products and third in farm products. Figure 2-14 shows the existing freight rail network in Minnesota. Figure 2-15 shows the mix of commodities that are shipped on Minnesota’s freight rail network.
Figure 2-14: Minnesota’s freight rail network
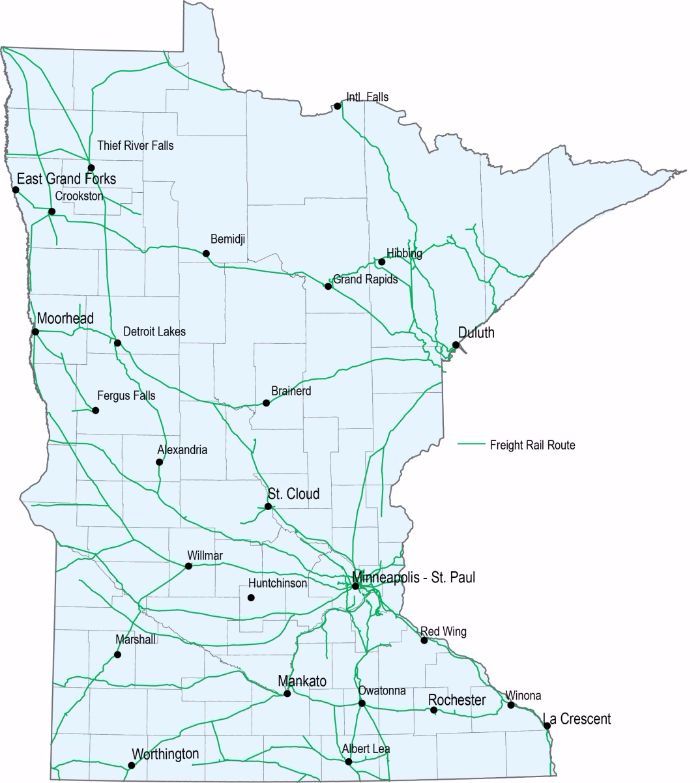
Figure 2-15: Commodities shipped on Minnesota’s freight rail network by weight, 2015[1]
Air
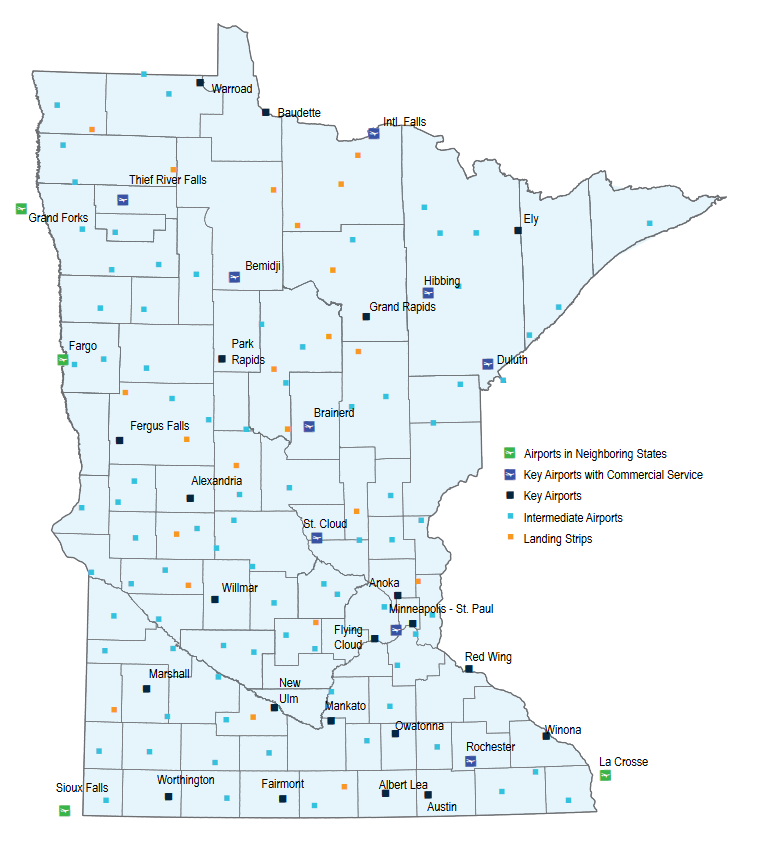
Minnesota’s air transportation system includes 388 airports, 135 of which are publicly funded. Some common aviation activities include personal travel, cargo services, medical transport, agricultural spraying and aerial surveying. Nine of the state’s airports offer ticketed airline service – Minneapolis-St. Paul, Bemidji, Brainerd, Duluth, Hibbing, International Falls, Rochester, St. Cloud and Thief River Falls.
Minnesota’s runways and taxiways are generally in good condition. Currently, over 94 percent of runway and taxiway pavements meet or exceed the standard for good quality. This beats the target of 84 percent or greater. Less than 3 percent of runways and taxiways are in poor condition. This meets the target of less than 4 percent.
Airports are classified based on their size and role in supporting their community. Figure 2-16 shows the existing airport network serving Minnesota.
Figure 2-16: Minnesota’s aviation system
Ports & Waterways
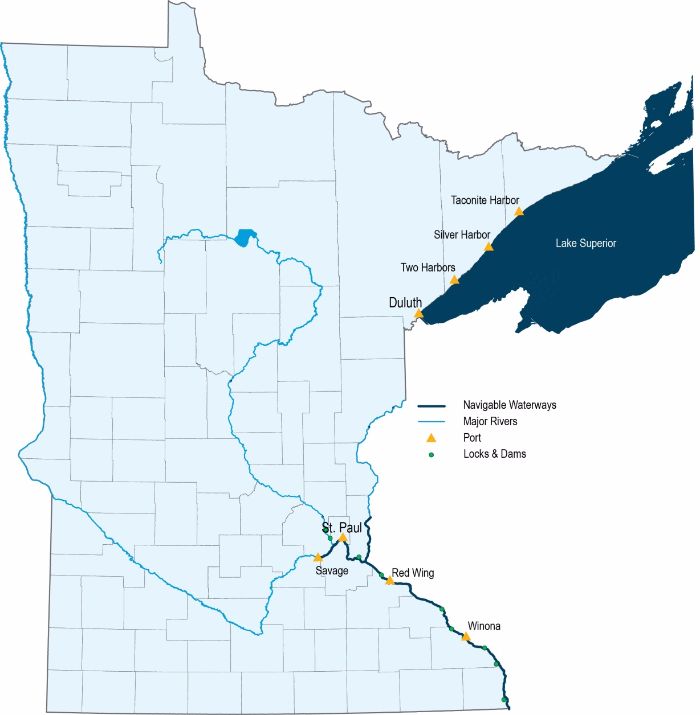
Minnesota has four ports on Lake Superior. They are located in Taconite Harbor, Silver Bay, Two Harbors and Duluth-Superior. The combined tonnage shipped from these ports in 2014 was more than 57 million net tons.
There are 219 miles of the Mississippi River that are used to move goods in Minnesota. The river supports four public port areas in Red Wing, Saint Paul, Savage and Winona. These ports were used to transport 10.7 million net tons in 2014.
The largest commodity category by tonnage shipped on Minnesota’s waterways is iron ore, iron and steel waste, and scrap. Figure 2-17 highlights the port and waterway system in Minnesota.
Figure 2-17: Minnesota’s ports and waterway system
Transportation Funding in Minnesota
Many partners are involved in funding Minnesota’s transportation system. The federal government, Tribal governments, state government, counties, cities, townships, metropolitan planning organizations, private corporations and non-profit organizations all provide transportation funding or help decide how money is spent. However, the specific role each partner plays is different. Some partners provide money through one or many more funding sources. Others only provide direction for how money from certain sources should be spent. Most partners do both. For each mode of transportation, the mix of funding partners is different. For example, local units of government provide the largest portion of funding for Minnesota roadways. However, the state’s rail system is primarily supported through funding from private corporations.
Funding sources can be grouped into two categories based on where the money comes from – transportation revenue or general revenue. Transportation revenue describes funding raised through the use of the transportation system or related activities. This includes taxes, fees and profits connected to transportation. Examples of transportation revenue are fuel taxes and money collected from passenger fares. Conversely, general revenue describes funding that is not directly tied to a transportation activity, such as property taxes. All transportation modes are funded to some extent by both transportation revenue and general revenue.
Different rules guide how money is allowed to be spent. Generally speaking, funds from public sources are distributed to specific projects and activities through programs (Figure 2-18). A funding source may contribute to only one program or many. Specific projects are often funded from more than one program. Putting it all together is a complex puzzle. Funding for any given project depends on a variety of factors such as the project purpose, transportation mode, scope, lead organization and timing.
Figure 2-18: Transportation funding process

Transportation projects can be grouped into different categories based on the type of activity. At a high level, the main types of activities are:
- Capital, which includes the construction of facilities and purchase of equipment. It can also include activities necessary to deliver capital projects such as planning, purchase of land, design, etc.
- Maintenance, which includes the rehabilitation of existing facilities and equipment, such as roadway repair.
- Operations, which includes activities that support the safe use of the system such as inspections, bus driving, plowing, traffic control, etc.
In addition to funding, financing is also an important tool used to support Minnesota’s transportation system. Funding refers to money available at the time of a project, such as having $20 in one's wallet. Examples of funding sources are taxes and fees. Financing, on the other hand, is money provided with the expectation that it will be paid back, usually with interest. This is like charging something to a credit card or taking out a loan. The money eventually needs to be repaid from a funding source. An example of financing is bonding. Funding and financing are both useful but it is important to understand the difference between them.
How the funding and financing pieces come together to build, maintain and operate the system is different for each mode of transportation. The following sections identify the key funding sources and programs for each transportation system - air, port and waterways, rail and surface transportation, which includes roadways, trails, transit and intercity bus service.
The information in this chapter represents a snapshot in time. It reflects current funding conditions, which may change as new laws or guidance are developed or as the use of the system changes. The summary is not an accounting of every dollar spent on transportation in Minnesota. Rather, it focuses on identifying the key funding sources and programs, and the relationships between them. It also focuses primarily on public sources of funding due to information availability.
Roadways, Trails & Transit
| Surface Transportation at a Glance |
|---|
| Size:
|
| Use:
|
| Responsibility:
|
The majority of roadways in Minnesota are the responsibility of local units of government – cities, counties, townships. Capital, maintenance and operations activities on these roadways are primarily funded by local general revenue, such as property taxes. State transportation revenue also supports some local roadways through the State Aid for Local Transportation program. Additionally, some federal programs target funding to local roadways.
The state highway system consists of interstates, U.S. highways and Minnesota highways. These roadways make up about 8 percent of the total roadway miles in Minnesota. For these roadways, state transportation revenue, specifically the state gas tax, is the largest funding source for capital, maintenance and operations activities. Federal programs are also a significant source of funding for the state system. They make up about a quarter of the funding for capital projects.
In addition to motor vehicles, bicyclists and pedestrians can also legally use Minnesota roadways, except where explicitly prohibited. Many roadways include specific bicycle and pedestrian elements to encourage safety for all users. Examples of these elements include bicycle lanes, sidewalks, and widened or paved shoulders. Since these elements are often included as part of roadway projects, they are typically funded by many of the same sources that fund general roadway projects.
Trails
In addition to on-road bicycle and pedestrian facilities (described in the previous section), trails, or shared-use paths, also provide important connections for those bicycling and walking. In Minnesota, trails are funded through a variety of programs at the federal, state and local levels. There are consistent funding programs for these projects at all levels, the specific amount available from each source varies year by year. Funding levels are affected by things such as the amount of money set aside by Congress or the Minnesota Legislature, bonding levels and how well proposed projects compete in various program solicitations.
Transit
In the Twin Cities, transit includes regular and express bus service, dial-a-ride bus service, bus rapid transit, light rail transit and commuter rail. For the purposes of this summary, commuter rail funding is discussed in the rail section of this chapter since it operates on the same network as freight and passenger rail services. The other types of transit are considered surface transportation since they operate on the roadway network or within roadway right-of-way. For these modes, capital projects are largely funded by federal transportation revenue, through programs such as New Starts. Transit maintenance and operations are primarily funded by state sources, such as the motor vehicle sales tax, which are distributed through the Metropolitan Transit Account. For major transitway projects, such as the Green Line, significant funding for capital and operations comes from county general revenue. In 2008, some of the metropolitan counties implemented a quarter cent sales tax to support the development and operations of the region’s transitway system. This money is distributed to projects within member counties for capital and operations through the Counties Transit Improvement Board.
In Greater Minnesota, the majority of public transit activities are funded through state sources. These include transportation and general revenue. Local sources make up approximately a quarter of Greater Minnesota Transit. Federal programs also provide revenue for capital and operations activities.
For all transit systems, money collected from passenger fares makes up a portion of the funding available for capital, maintenance and operations activities. However, the amount varies widely among different transit services throughout the state.
Intercity Bus
Most intercity bus services in Minnesota are owned and operated by private companies and funded through private sources. However, some carriers receive public funding assistance to support their operations and create or enhance access to small towns across the state. This public funding assistance comes primarily from federal and state transportation revenue through the Minnesota Intercity Bus Program.
A more detailed summary of the funding sources and programs that support Minnesota’s surface transportation system is included in Appendix C.
Rail
| Rail Transportation at a Glance |
|---|
| Size: Minnesota’s rail system is made up of 4,485 total route miles, including 381 miles of passenger rail service and 40 miles of commuter rail service. |
| Use: The rail system primarily supports 21 freight railroad companies, one passenger rail line (Amtrak's Empire Builder) and one commuter rail line (Metro Transit's Northstar). |
| Responsibility: Minnesota's rail system is mostly owned by private railroad companies. Passenger and commuter rail services have rights / agreements with the railroads for the use of the tracks. |
Freight Rail
Private funding from the 21 freight railroad companies operating in Minnesota is the main source for capital, maintenance and operations activities on the state’s rail system. Publicly-owned railways rely on federal, state and local sources of funding in addition to public-private partnerships. Typically, public funding for the rail system comes from general revenue.
Passenger Rail
Passenger rail operations for Amtrak’s Empire Builder are largely funded through Amtrak revenue, such as ticket sales and advertising, and federal general revenue. Capital and maintenance activities related to train equipment are also funded through these same sources. Capital and maintenance activities related to rail tracks are mostly funded through the private railroad companies, occasionally in partnership with the state. Planning and development of future passenger rail service is primarily supported by state general revenue.
Commuter Rail
Northstar commuter rail capital, maintenance and operations are funded as part of Metro Transit’s budget. In addition to money from passenger fares, funding comes largely from state transportation revenue through the Metropolitan and Greater Minnesota Transit Accounts.
Light rail and streetcar services are considered transit and are included in the roadways, rails and transit section. A more detailed summary of the funding sources and programs that support Minnesota’s rail system is included in Appendix C.
Air
| Air Transportation at a Glance |
|---|
| Size: There are 388 airports in Minnesota:
|
| Use: Airports in Minnesota support general aviation activities (e.g. agricultural spraying, business travel, firefighting), air cargo and commercial airline service. |
| Responsibility: Local units of government are responsible for public airports in Minnesota. |
General Aviation
Most of Minnesota’s public airports are the responsibility of local units of government. They receive the majority of their capital funding from federal transportation revenue through the Airport and Airway Trust Fund. State and local sources also contribute to capital projects and are the primary sources for airport maintenance and operations activities. The State Airports Fund is the main state funding source and is made up of transportation revenue, specifically revenue from aviation activities. Local funding sources include a mix of transportation and general revenue. Additionally, airports can receive funding from private investment, including occasional public-private partnerships.
Commercial Airline Service
Commercial passenger service in Minnesota is primarily set-up and funded by the airlines serving the state. Some federal transportation revenue is used to support commercial service as part of the Essential Air Service program.
A more detailed summary of the funding sources and programs that support Minnesota’s aviation system is included in Appendix C.
Ports & Waterways
| Ports & Waterway Transportation at a Glance |
|---|
| Size: Two waterway systems (Mississippi River and Great Lakes-St. Lawrence Seaway), 219 navigable river miles, eight ports and 10 active locks and dams. |
| Use: Ports and waterways are primarily used to move bulk freight but also support recreational activities. |
| Responsibility: The majority of port terminals are privately owned. The federal government is responsible for all locks and dams. |
Ports
Most port terminals in Minnesota are privately owned and funded entirely through private sources. Public port authorities often lease port land to private companies to operate port terminals. Additional funding for public port authorities comes from state general revenue and is available for capital projects as part of the Port Development Assistance Program. Operations and maintenance activities are funded almost exclusively through revenue received from the use of the ports.
Waterways
Minnesota’s navigational channels and locks and dams also require investment to stay operational. This funding comes through the US Army Corps of Engineers and includes federal transportation and general revenue.
A more detailed summary of the funding sources and programs that support Minnesota’s port and waterway system is included in Appendix C
1 MN Department of Employment & Economic Development, 2015
2 Ibid.
3 MN Department of Natural Resources
4 Ibid.
5 Federal Highway Administration, 2015
6 Levinson, David; Greg Lindsey; Yingling Fan, Jason Cao, Michael Iacono, Martin Brosnana, Andrew Guthrie and Jessica Schoner (2015) “Chapter 5: Biking and Walking over Time” Travel Behavior Over Time. University of Minnesota Center for Transportation Studies, Sponsored by: Minnesota Department of Transportation and the Metropolitan Council.
7 Metropolitan Council Travel Behavior Inventory, 2010
8 2000 U.S. Census & 2005 – 2015
9 Federal Highway Administration, Note: This data includes only shipments to, from, or within Minnesota and does not include shipments passing through the state.