
Chapter 3 - What is changing?
Trends Impacting Minnesota
Minnesota is changing. Future changes will create new demands on the transportation system. Learning about these changes is a vital part of planning a safe and efficient transportation system. The Minnesota GO Vision calls for a transportation system that can adapt to whatever the future might hold.
This chapter describes opportunities and challenges that will impact Minnesota in the next 20 years. The trends are broken into five categories: population, economy, environment, transportation behavior and technology. See the "Want to Learn More" section of the Appendices for links to the full papers on each trend.
Population
Minnesota is home to a growing and changing population. The state is projected to grow in total population and in diversity. Transportation planning affects everyone, but in different ways.
There are many ways to look at how Minnesota’s population is changing. Three trends stand out among the others for special focus.
- Minnesotans are aging. As the baby boomers grow older they will require different options to maintain the level of mobility they enjoyed in the past.
- Urban areas are seeing increasing population growth. This impacts how people travel to, between and within communities.
- Minnesota is becoming more diverse. This raises questions about how transportation can help address the socioeconomic disparities that exist and that have remained constant throughout recent decades.
More information about the state’s population can be found in the Demographic Trends paper. The health of Minnesotans is another important trend. Detailed information about transportation and public health can be found in the Health Trends in Minnesota paper.
Minnesota’s Aging Population
Minnesota’s population as a whole will become older in the next 20 years. Just less than 14 percent of the population is currently above age 65.[1] The number of seniors in Minnesota is projected to grow until hitting a peak in the year 2035. At that point there are projected to be more than 1.2 million seniors in Minnesota (20 percent of the population). In 2035, for the first time, more Minnesotans will be older than age 65 than under age 18. Growth in the senior population will impact the entire state, as is shown in Figure 3-1.
Figure 3-1: Percentage of county residents over the age of 65 [2]
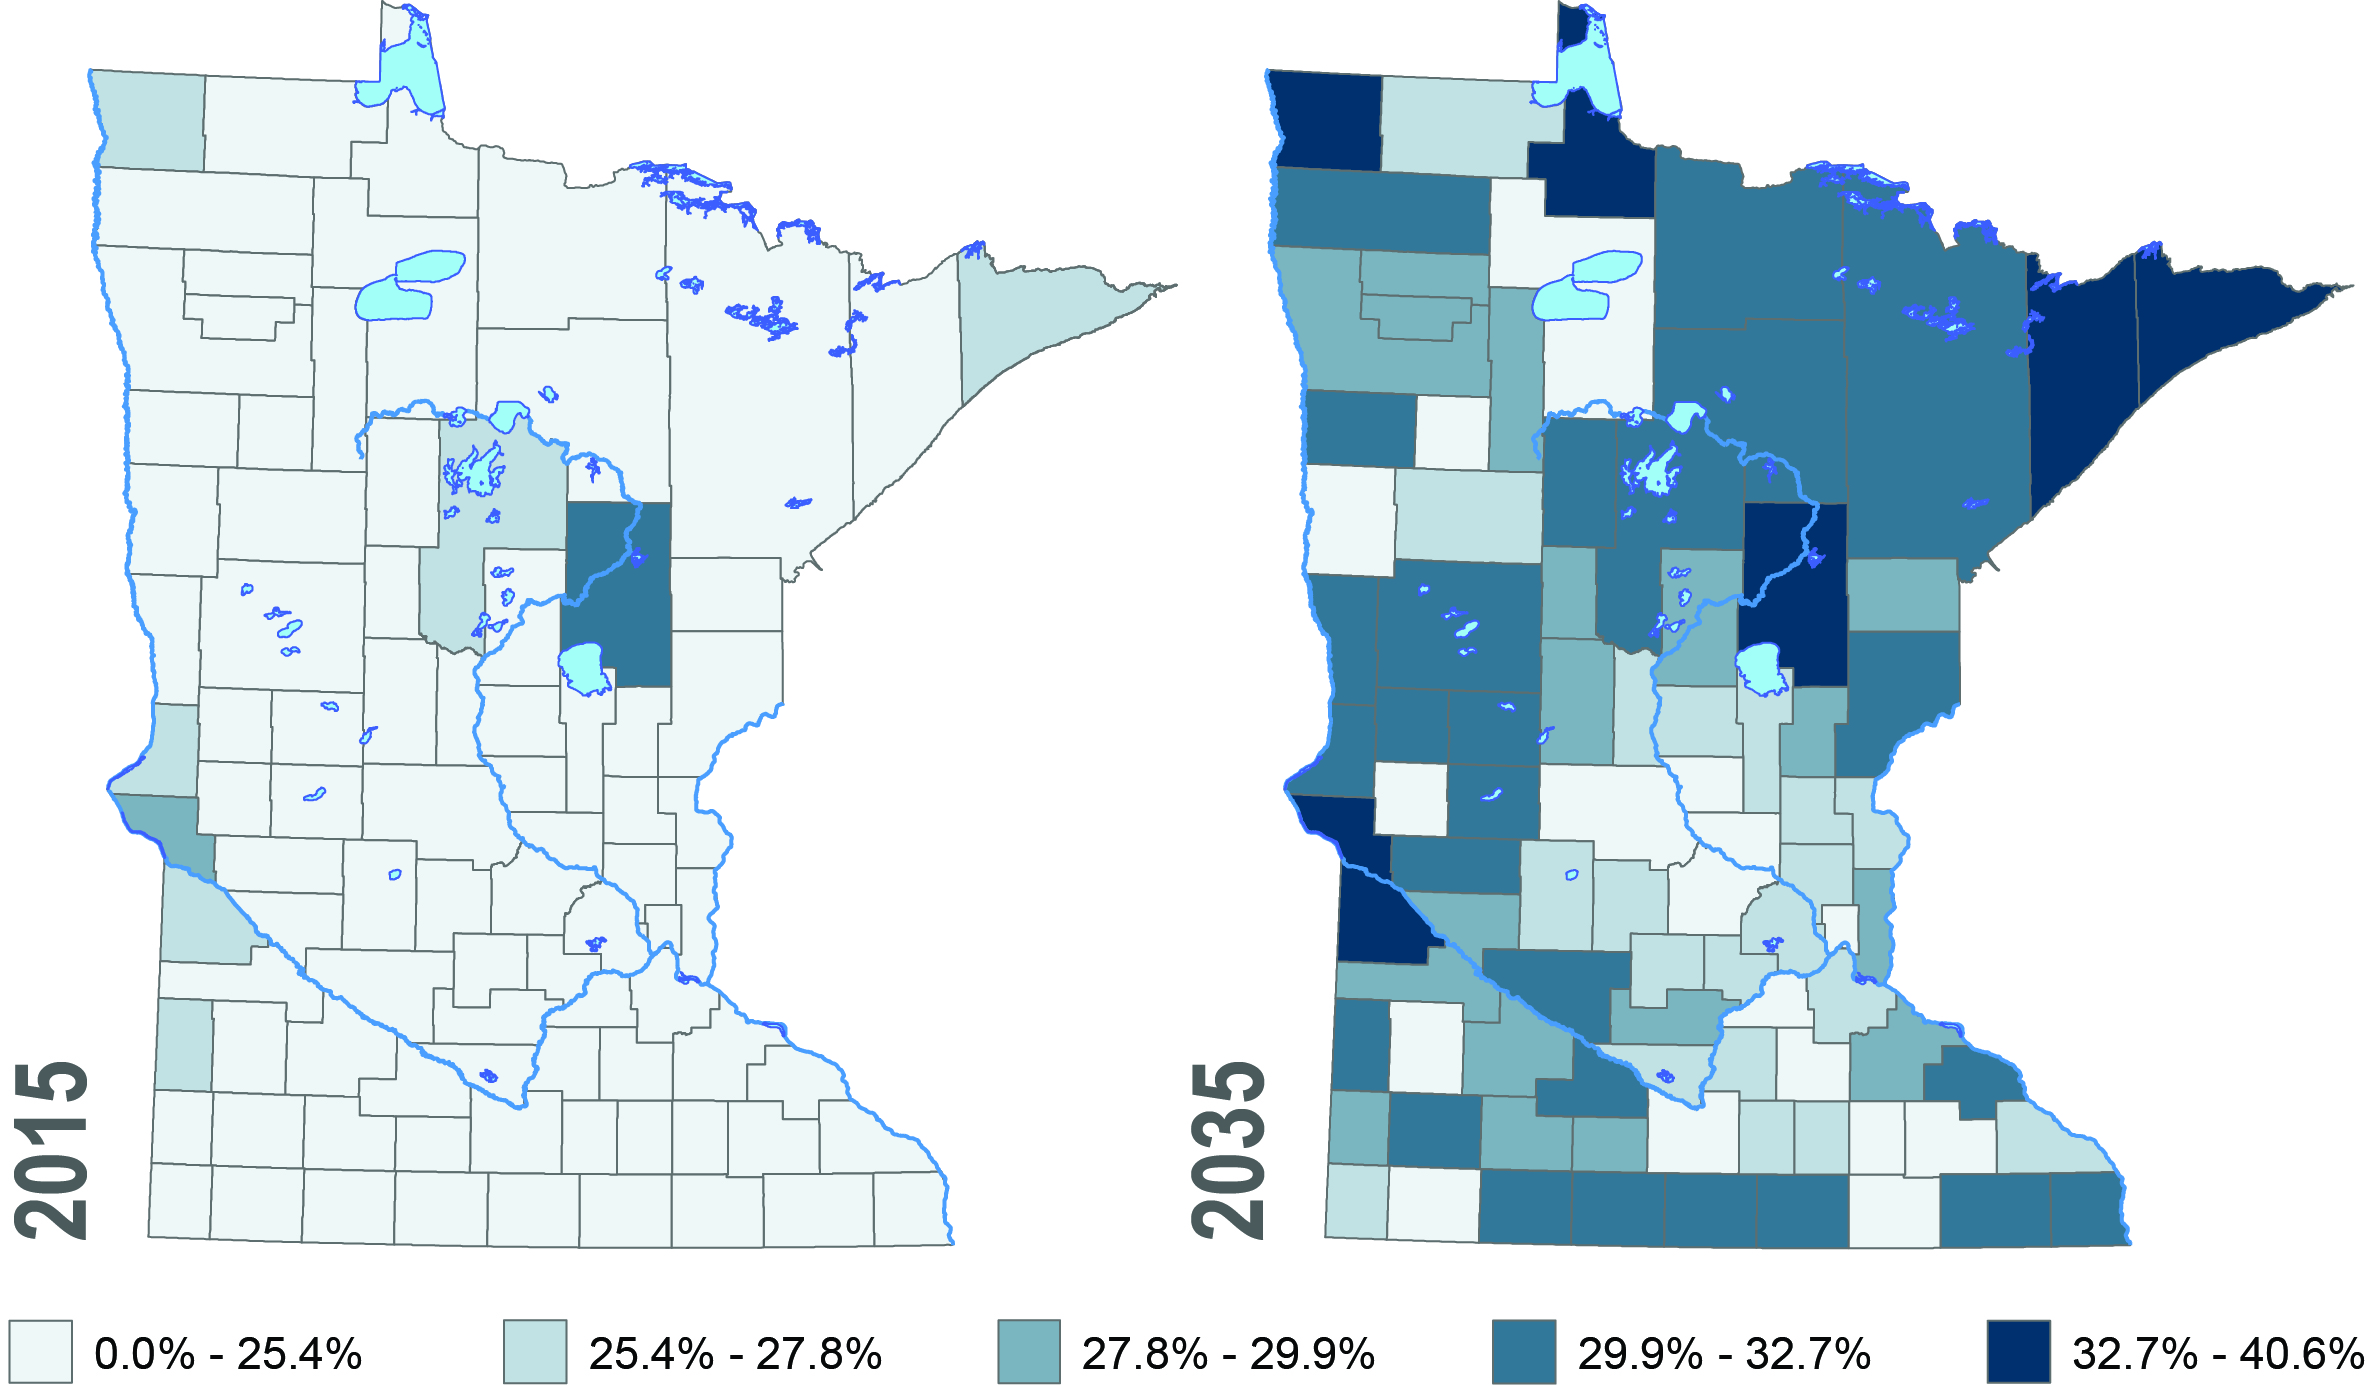
Ensuring that seniors have regular, safe and affordable ways to get around is important. As people age, they are more likely to have limited travel options. More than 30 percent of Minnesotans age 65 and older and 45 percent of those age 75 and older report they have a disability. [3] This can have a major impact on how people get from place to place. For example, the number of rides provided by Metro Mobility in the Twin Cities grew by 6.8 percent from 2014 to 2015.[4] This number is likely to increase well into the future.
Urban & Rural Population Trends
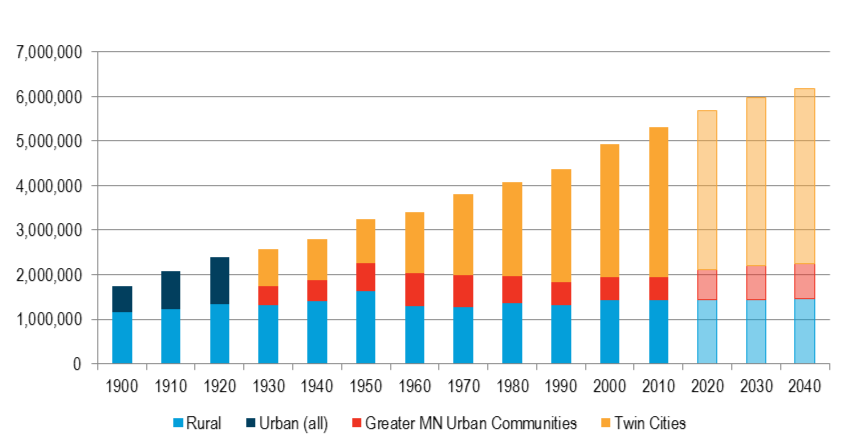
Minnesota is becoming more urban in all parts of the state. More than 70 percent of people live in cities and towns with populations of more than 2,500 people.[5] The number of people living in rural areas has stayed relatively consistent since 1900. Minnesota’s urban population has grown significantly during the same time. The Minnesota State Demographer estimates that most counties will grow in population during the next 30 years. The largest population growth is projected to occur in the Twin Cities region. A smaller rate of growth is expected in Greater Minnesota’s urban communities. This information is shown in Figure 3-2.
Figure 3-2: Minnesota’s historic and projected urban/rural population split [6]
A growing urban population will use transportation in different ways than people do today. It will be important to provide a variety of options for people to travel within and between urban areas.
Racial Disparities & Equity
In the last 50 years, Minnesota’s population has become much more diverse. In 1960 only 1.2 percent of the state’s residents were people of color. Today there are more than one million people of color in Minnesota, nearly 20 percent of the population. This number is projected to grow in the next 20 years. By 2035, one in four Minnesotans will be people of color.
As Minnesota becomes more diverse, the state must address the stark disparities that exist between white people and people of color. Minnesotans of color earn less than half the income that white Minnesotans do on a per-capita basis. Minnesotans of color also have lower high school graduation rates than white Minnesotans. Further, Minnesotans of color are far more likely to be unemployed.[7] Recent analysis by the Metropolitan Council showed these disparities cannot be fully explained by differences in demographic factors, such as age, immigration and language ability, level of education or employment status.[8] Advancing equity in Minnesota is critical to the health and well-being of the state. It is critically important to make sure that all people have access to a healthy and prosperous future.
Economy
The last 20 years saw significant changes in the state’s economy. Moving forward, transportation will need to evolve to meet the needs of a changing economy. This is an essential part of realizing the Minnesota GO Vision.
Many different systems must work at once to keep Minnesota’s economy strong. Transportation provides the backbone for connecting people to jobs and moving goods from producers to buyers. Shippers are developing new methods to more efficiently transport freight using existing systems such as freight rail and new logistics concepts.
Keeping the transportation systems the economy relies on in good shape can be a challenge. Public-private partnerships have been proposed as a way to infuse capital into the system. The partnerships could also provide greater flexibility when carrying out a project. Dynamic pricing offers another way to charge users depending on existing demand.
Economic Sectors & Employment Patterns
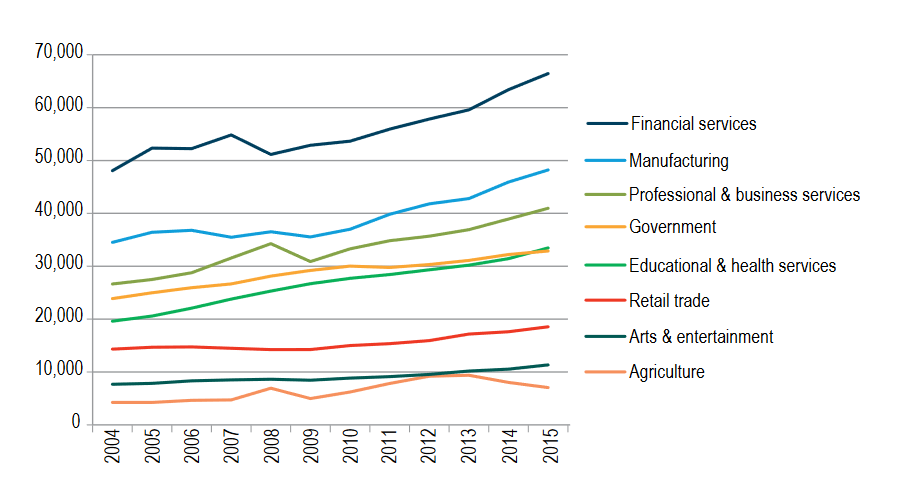
Trends in the economy reflect many other changes occurring at the same time. In general, the state’s economy is shifting from farming and manufacturing toward service industries. Figure 3-3 shows Minnesota’s Gross Domestic Product by economic sector from 1997 to 2014. Minnesota has seen a period of economic growth in recent years. Unemployment and underemployment are now below pre-recession levels. Despite this, growth has not reduced the racial disparities discussed earlier.
Figure 3-3: Minnesota Gross Domestic Product (2015 dollars) by top economic sectors, 2001-2015 [9]
Congestion on the transportation system can cause problems for people traveling to work and goods traveling to market. MnDOT tracks freeway congestion in the Twin Cities.[10] Since 2010, the percentage of freeway miles congested during peak travel periods in the Twin Cities remained close to 20 percent, with minor fluctuations up and down.
Aging Infrastructure
Infrastructure across the country is aging. Many of the public systems that serve communities throughout the nation were built between 40 and 70 years ago. At that time, the growth of urban areas required a rapid build out of road, sewer, water and utility systems. To illustrate the trend, Figure 3-4 shows the age of pavements on the state highway system in Minnesota.
Figure 3-4: Age of pavement on Minnesota’s state highway system, 2014[11]
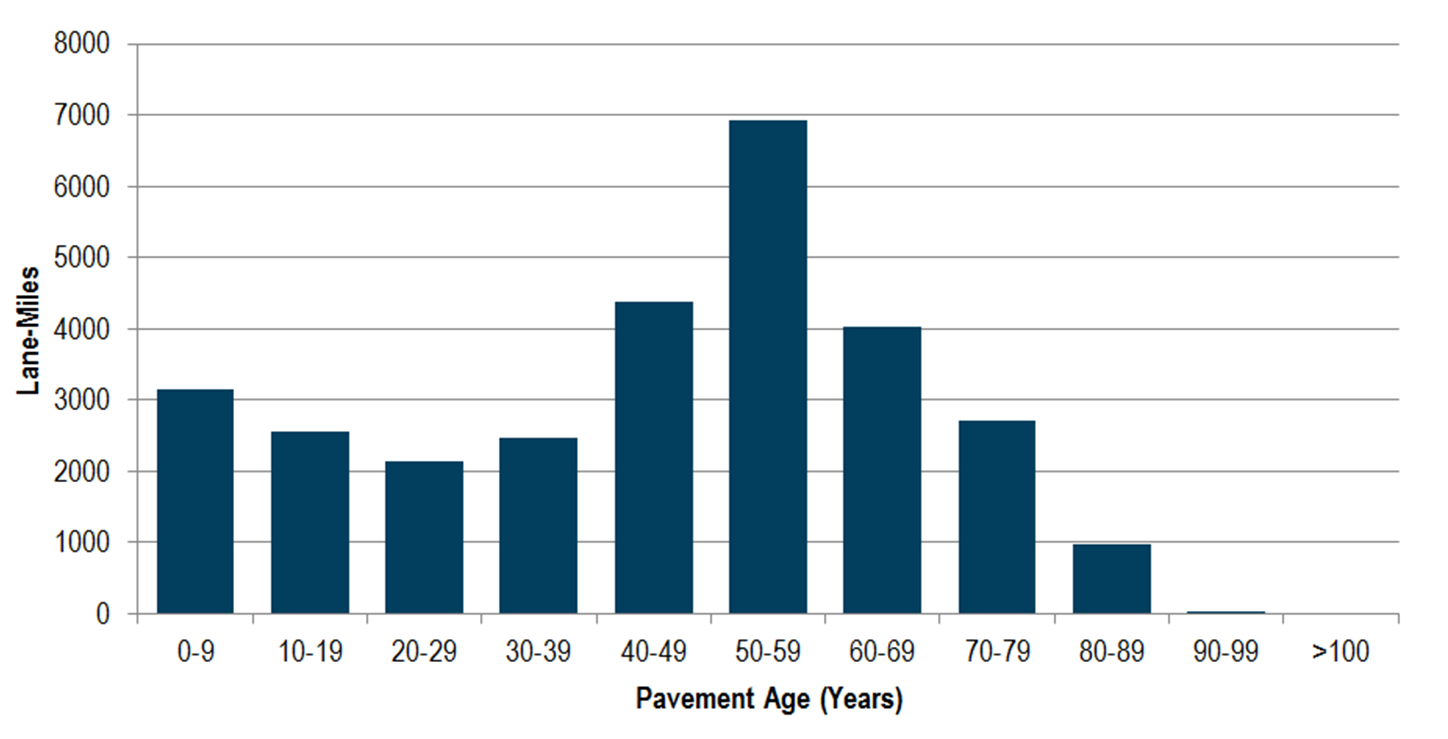
Minnesota faces a wave of aging roads and bridges that need upkeep. MnDOT typically reconstructs roads when they are between 70 and 80 years old. Bridge replacement typically occurs at 50 to 100 years. Additional needs for maintenance can be found on city and county roads and Minnesota’s airports, railroads, ports and waterways. These needs add to a seemingly ever-growing list of investments that must be made to maintain the quality of the state’s public systems.
Environment
Minnesota’s environment is changing. Everything that Minnesotans do has some impact on the state’s natural resources and climate. Learning how transportation is part of these changes is important when planning to limit or reduce negative impacts in the future.
Environmental Quality
Transportation impacts the air, water, plant and animal resources in the state. As the population grows so does the demand on natural resources. Studying transportation’s effects on environmental quality today shows where changes are needed. Ideally, transportation investments and strategies may even be able to help improve the environment.
On-road vehicles are the biggest source of air pollution in Minnesota. Despite growth in vehicle miles traveled, emissions from highway vehicles dropped by more than 50 percent over the last 25 years. This drop is largely due to changes in federal vehicle and fuel standards. Further reductions in emissions could also help to limit public health impacts from air pollution.
The transportation system also impacts Minnesota’s water quality. Run-off from roads can carry pollutants into bodies of water and wetlands. Chloride (i.e. salt) is one pollutant of concern because of its effects on wildlife and drinking water supplies. Chloride is very difficult to remove once present in a body of water.[12]
Many of the state’s ecosystems are now home to invasive species. The transportation system may offer easy ways for invasive species to spread. The impacts of some invasive species are only a nuisance, while others can potentially be devastating. Examples of invasive species include zebra mussels, emerald ash borer, silver carp and buckthorn. In some cases, the effects include the extinction of native plants and animals.[13]
MnDOT works with partners to develop seed mixes that stabilize soils and improve biodiversity along roadways. These mixes serve different functions and suit different growing zones. Native plants can help limit the spread of noxious weeds and provide habitat and food for pollinators and other animals.
Climate Change
Climate change is already having major impacts in Minnesota and will continue to have impacts into the future. What these future impacts will be is not always clear. More varied temperatures, precipitation levels and frequency of extreme weather events will stress the transportation system. It is possible that these changes could increase maintenance costs and impact the way that Minnesotans travel.
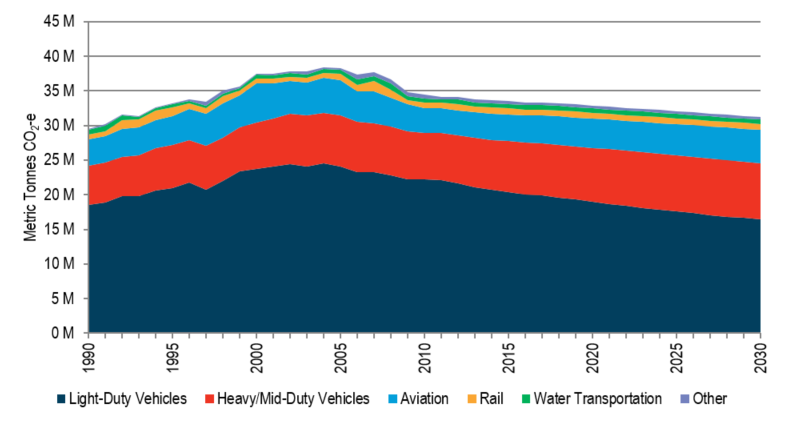
Reducing greenhouse gas emissions from burning fossil fuels is key to limiting climate change impacts. Figure 3-5 shows past and future emissions from transportation in the state. Emissions are going down, but the state is not on track to meet the 2007 Next Generation Energy Act targets. Reducing emissions will require shifting away from gasoline-powered vehicles and promoting cleaner transportation options.
Figure 3-5: Historical and projected transportation sector greenhouse gas emissions in Minnesota[14]
Climate change adaptation can reduce the impacts of climate stresses (long-term increases in vulnerability) and shocks (extreme events). There are many ways transportation partners can work on adaptation, such as designing bridges and culverts for larger rain events. A variety of activities can reduce the impact of climate change and lead to broader benefits for communities in Minnesota.
Potential effects of Climate Change in Minnesota
Minnesota’s climate is already changing and is likely to continue to see changes in a number of areas. These changes can have negative effects on the state’s transportation system. However, changes in certain areas are more likely to occur than in others. For example, Minnesota has already seen increased heavy precipitation / flooding in recent years. It is very likely that this trend will continue into the future.
| Climate Impact | Confidence in change for MN during next 20 years | Potential Negative Effects to Transportation System |
|---|---|---|
| Heavy Precipitation / Flooding | Very High | Damage to highway, rail infrastructure, hydraulics infrastructure, airport runways Overtopping roads will slow operations and performance. |
| Warmer Winters | Very High | More ice build-up and freezing precipitation Reduced pavement conditions and life cycles Downed power lines with ice storms Reduced ice cover on water bodies leading to greater rates of evaporation |
| New species ranges | High | Changes in roadside vegetation mixes Soil erosion Increase in invasive species populations Increased exposure of construction and maintenance crews to vector-borne diseases |
| Drought | Medium | Reduced river navigability for barges Stress roadside vegetation, which may reduce rainwater storage and increase soil erosion in the long-term |
| High Heat | Low | Pavement and rail buckling Vehicles overheating Electrical system malfunctions Limitations on construction hours |
| Wildfires | Unknown | Road closures Immediate and significant threat to human safety Damage to roadside infrastructure |
Transportation Behavior
As Minnesota changes, so will the state’s transportation needs. Anticipating trends in transportation behavior will help MnDOT and other transportation partners meet the needs of all users. Understanding these needs will help ensure that people and goods move safely and efficiently.
Twin Cities residents are increasingly using options other than cars to travel. Per-capita vehicle miles traveled remains below the peak set in 2004. Transit ridership and the percentage of people who bicycle and walk have grown in recent years.[15] Data suggests that more investment in transit, bicycling and walking infrastructure would encourage people to use these modes more often.
People in Greater Minnesota drive more on average than people living in the Twin Cities. This trend is likely to continue into the future. Pper-capita vehicle miles traveled in Greater Minnesota grew in 2015. This suggests that a persistent decline since 2004 may be reversing. Much like in the Twin Cities, further investments in transit systems and local bicycle and walking infrastructure may increase the use of these options.
Telecommunication systems also play a part in how people travel. As access to high speed internet grows, more and more people will have the option to shop, see a doctor, or work online. The implications of this shift on transportation are uncertain at this time, but warrant careful attention going forward.
Mobility as a Service
New companies and technologies have made people re-think how they travel, especially in urban areas. Mobility as a service offers new ways to use the system through the “sharing economy.” One example of mobility as a service is car sharing, available through companies such as Zipcar in the Twin Cities, Mankato and Winona. Other ride matching services such as Uber and Lyft have seen rapid growth in recent years.
Many questions remain about how mobility services will evolve in the future. Currently, it is not uncommon for a person to use many different services. The advent of self-driving cars also has the potential to reshape entire systems as they are known today. Self-driving cars combined with mobility-as-a-service platforms could also reduce overall car ownership levels.
Technology
Technology and transportation have captured people’s imaginations for many years. New ideas in transportation have the potential to impact many of the topics discussed in this chapter. The use of mobile technology can make travel time more productive and help people choose how to travel. Emerging technologies often use vast amounts of data and track user preferences and locations. These practices give rise to concerns about user privacy and data security.
Sales of unmanned aerial systems, commonly referred to as drones, are projected to grow dramatically in the near future. Sales in the U.S. are expected to grow from 2.5 million in 2016 to 7 million in 2020. More widespread use of drones could have positive impacts, but also raises privacy and air safety concerns.[16]
Alternative Fuels & Vehicle Electrification
Alternative fuels are widely used amid political and environmental concerns over the use of oil. Alternative fuels include biofuels, compressed natural gas, electricity and others. Subsidies are often needed to get alternative fuels off the ground. Any new fuel faces the barrier of a proven fossil fuel system that works with nearly every vehicle on the road. Despite these challenges alternative fuels have advanced in recent years.
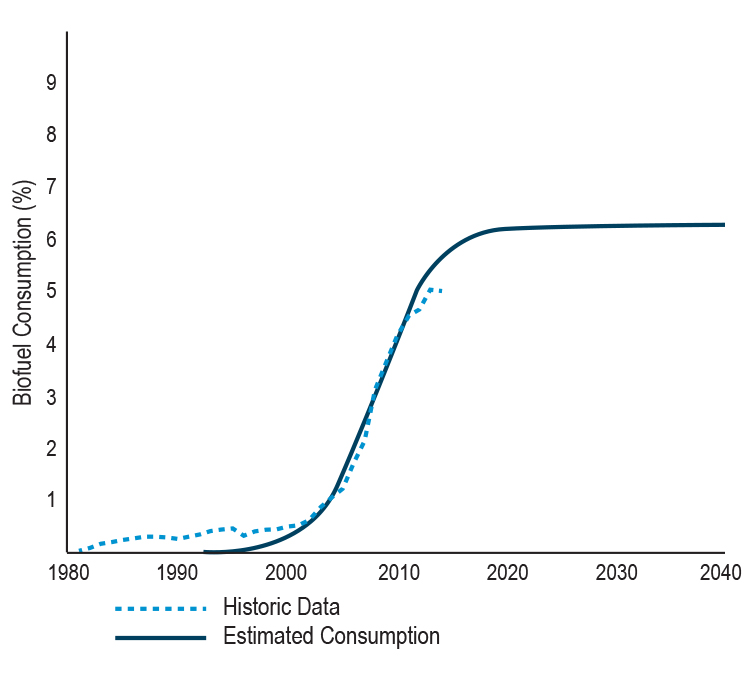
Biofuels have long been the most visible alternative fuel in Minnesota. Despite this, projections shown in Figure 3-6 suggest that they may soon reach the peak of their market share.[17] Electric and hybrid-electric vehicles made rapid advancements in recent years. These vehicles are now available at prices closer to traditional vehicles. Investments in charging infrastructure will be necessary if sales of electric vehicles are to continue growing in Minnesota.
Figure 3-6: Historic and projected biofuel use as a percent of all transportation fuels in Minnesota
Autonomous Vehicles
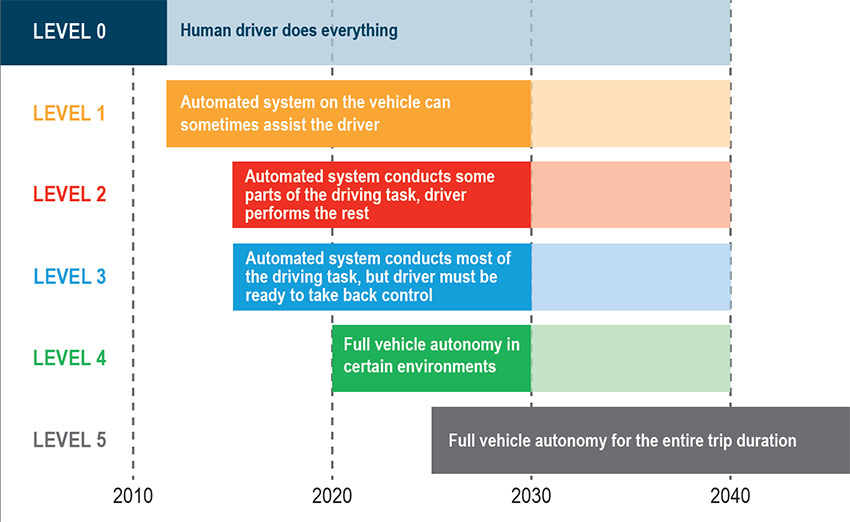
Self-driving vehicles are emerging rapidly and could re-shape the ways people travel. Connected vehicles technologies (a related but distinct concept) will likely enhance the advances brought by self-driving cars. More details can be found in the Autonomous Vehicles paper. As of 2012 all new cars sold in the U.S. have electronic stability control. This places them on Level 1 of the autonomous vehicle scale.[18] Many cars purchased today have several automated systems that work together, such as adaptive cruise control, that place them on Level 2. Figure 3-7 shows the projected progression through autonomous vehicle phases.
Figure 3-7: Projected timeline and definition of autonomous vehicle levels[19]
Advances in safety are one of the most highly touted benefits of self-driving cars. Self-driving cars have nearly instant perception. They do not get tired, distracted, or suffer from many of the other factors that limit human drivers. These same advantages may result in shorter following distance requirements that could increase capacity on existing roadways.
Regulation of autonomous vehicles may limit the ways they can be used. In theory, self-driving cars could carry out deliveries or drive themselves to pick up a person wherever they may be. Self-driving cars could also provide mobility options for individuals with disabilities who otherwise cannot operate a vehicle. However, the potential of the technology will depend on whether or not a human driver legally must be present.
Regardless of self-driving car advances, it is unlikely that these vehicles will be a cure-all for transportation. Essentially effortless automobile travel is likely to lead to even more driving. As such, self-driving cars are unlikely to solve congestion on the highway system even if they offer some capacity benefits. Additionally, transportation options aside from driving will still be needed to facilitate the variety of trip types that Minnesotans take every day. The cost of this technology as it rolls out, and who is able to benefit from it, will also be a concern for transportation partners moving forward.
1 American Community Survey, 2014
2 Minnesota State Demographer
3 American Community Survey, 2014
4Metropolitan Council, 2016
5 2010 U.S. Census; The U.S. Census definition of urban is any community with a population over 2,500.
6 US Census; Minnesota State Demographer
7Racial Disparities & Equity, 2016
8 Diving Deeper Summary: Understanding the Twin Cities Region's Racial and Ethnic Disparities, 2016
9 MN DEED Quarterly Census of Employment & Wages Note that agriculture in this chart refers to only farm activities.
10 Congestion is defined by the percent of freeway miles operating below 45 mph during peak periods
11 MnDOT Transportation Asset Management Plan, 2014
12 MN EQB Water Policy Report, 2016
13Minnesota Department of Natural Resources
14 Emissions data from MPCA; does not include emissions from natural gas pipeline transmissions
15Metropolitan Council Travel Behavior Inventory
16 Federal Aviation Administration, 2016
17 Levinson, 2016
18 NHTSA, 2016
19 Adapted from Levinson, 2016