
Non-Motorized Transportation Safety
Traffic deaths have declined nationally from over 54,000 in the 1970s to under 39,000 in 2020.1 This is a decrease of over 30%, occurring even as the population rose 60% over the same time. However, this decline does not account for differences in risk between motorized and non-motorized roadway users. Motor vehicle passengers have seen the greatest increases in safety measures, resulting in the largest decline in roadway related deaths. While pedestrian and bicycling deaths are slightly below earlier peaks, there has been a backslide in recent years. Now, more Americans are dying on foot or bicycle than any year since 1990.
Motor vehicles are safer than ever for drivers and passengers. However, these new vehicles are more likely to be heavier and more dangerous for pedestrians and bicyclists if a crash occurs. Investments in safety engineering and design have lowered severe traffic incidents considerably for vehicles; however, pedestrian and bicyclist infrastructure has lagged in the meantime.
In 2020, 7,709 (one-fifth) of roadway deaths were our roadway’s most vulnerable users: pedestrians and bicyclists. In Minnesota, 58 of 364 roadway deaths were people walking and bicycling.2 For much of the twentieth century, deaths or serious injuries resulting from traffic crashes were thought of as an unfortunate but unavoidable side effect of the automobile. That sentiment has changed with the growth of increased safety awareness and policies. Initiatives like Vision Zero and Minnesota’s Toward Zero Deaths program have grown over the previous two decades, contending that even a single death on the nation’s roadways is too many.
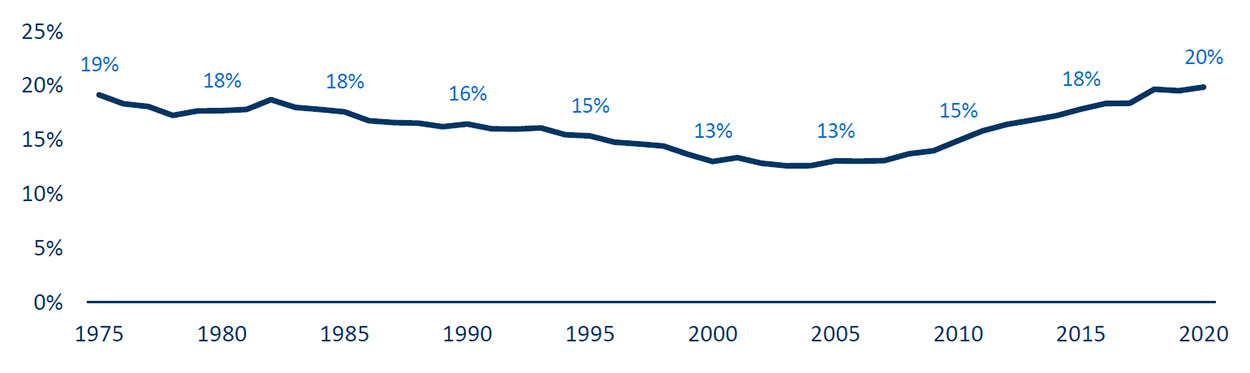
U.S. roadways have become safer even as they handle more traffic every year. More people are traveling more miles than ever, but deaths and injuries have fallen from their peak decades ago. For roadway users, deaths peaked in the 1970s. However, increased pedestrian and bicyclist deaths in the past decade have led to the highest share of deaths for those roadway users as seen in Figure 1. Transportation agencies have work to do in order to make the nation’s transportation system safe for all users, especially the most vulnerable.
Figure 1. Total share of traffic deaths for pedestrians and bicyclists nationally from 1975 to 20203
CITATIONS
1. NHTSA 2020 Annual Report https://crashstats.nhtsa.dot.gov/Api/Public/ViewPublication/813266.
2. “Transportation Safety, Minnesota,” Bureau of Transportation Statistics, accessed June 1, 2021, https://www.bts.gov/browse-statistical-products-and-data/state-transportation-statistics/transportation-safety.
3. “Traffic Safety Facts Annual Report Tables,” National Highway Traffic Safety Administration, accessed June 1, 2021, https://cdan.nhtsa.gov/tsftables/tsfar.htm#; NHTSA 2020 Annual Report https://crashstats.nhtsa.dot.gov/Api/Public/ViewPublication/813266.