
Chapter 2: Key Factors and Assumptions
MnDOT considered or accounted for several key factors in establishing investment priorities for the state highway system. Some of these factors pose large challenges to both managing the existing infrastructure and making improvements to the system. These challenges include a widening gap between highway revenues and construction-related costs, federal and state legislative and performance requirements, MnDOT policy, and a large and aging highway system in need of repair and reconstruction. MnDOT analyzed these and other factors to guide the development of MnSHIP.
The key messages of Chapter 2 are:
- State law requires a fiscally constrained, performance-based 20-year capital investment plan for the state highway network every four years.
- MnDOT will have approximately $21 billion to invest in state highways over the next 20 years.
- The recent federal bill, the Fixing America’s Surface Transportation Act, increases emphasis on freight investments through the creation of the National Highway Freight Program.
- MnDOT policy emphasizes investment toward the Minnesota GO Vision to maximize the health of the people, the environment and the economy.
- The state highway system is aging. Because of its age, it will need increased capital improvements as well as additional maintenance in the years ahead.
Revenue Outlook
MnSHIP is a fiscally constrained plan, meaning it sets investment priorities only for the revenues that are expected to be available during the next 20 years. MnDOT identified the various revenue sources that are used to fund the state highway system and analyzed the trends affecting these revenues. This analysis provided the information necessary to develop revenue assumptions and projections for the 20-year planning period. Appendix E: Financial Summary presents an in-depth review of Minnesota’s state highway funding.
Taxes and fees from four main revenue sources fund transportation improvements on Minnesota’s state highways. These sources are:
- Federal-aid (gas tax and General Funds)
- State gas tax (motor fuel excise tax)
- State tab fees (motor vehicle registration tax)
- State motor vehicle sales tax
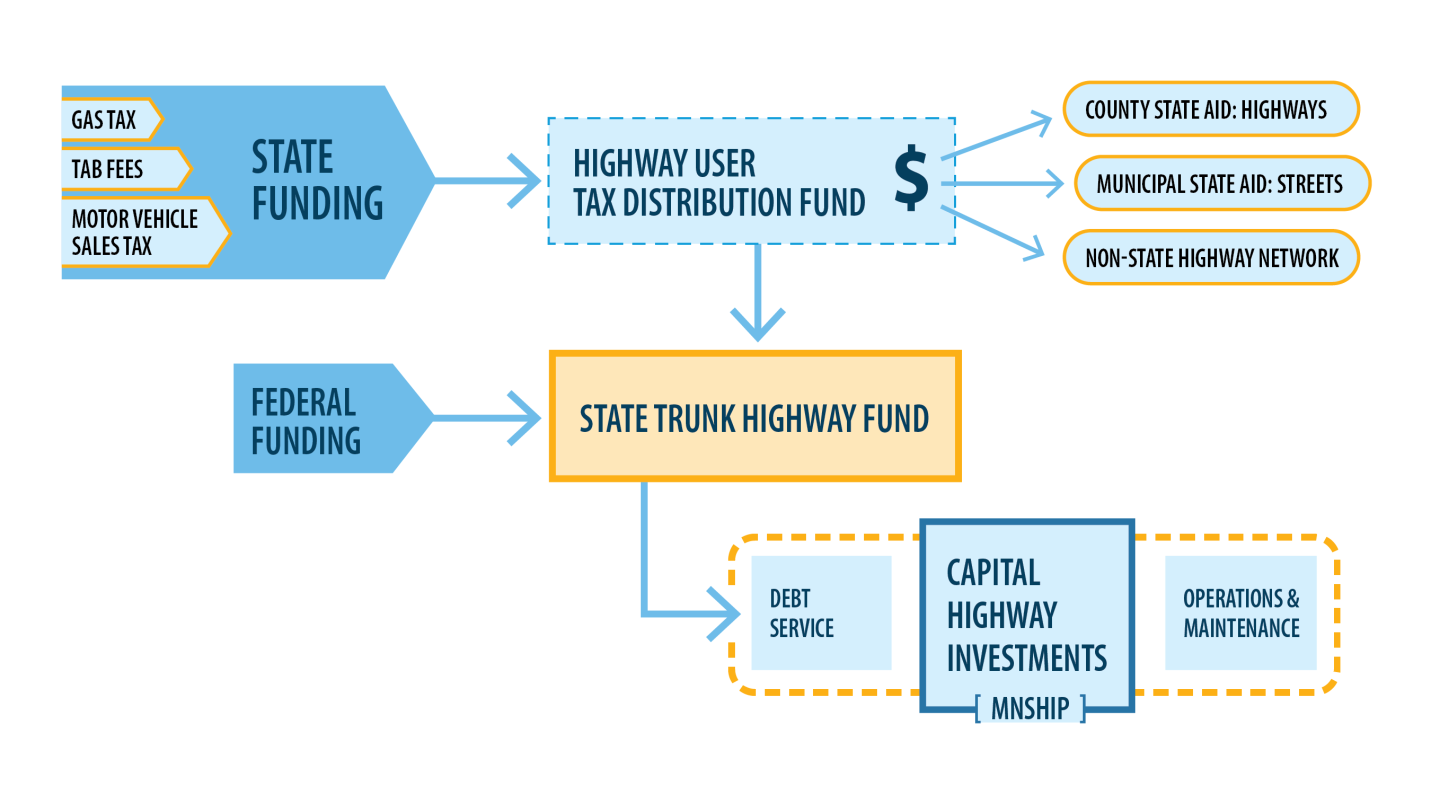
The revenues from Federal-aid go directly to the State Trunk Highway Fund (Figure 2-1), which funds capital improvements on the state highway system. Revenues from the main state sources, as well as smaller revenue sources, are pooled into the Highway User Tax Distribution Fund and divided between state highways, county roads, and city streets based on a Minnesota constitutional formula. Approximately 5 percent of these funds are set aside for the Non-State Highway Network (which includes the Flexible Highway Account, Township Roads Account, Township Bridges Account and the Department of Natural Resources). The remaining 95 percent is split among the State Trunk Highway Fund, County State Aid Highways and Municipal State Aid Streets. The portion allocated from the highway fund to the State Trunk Highway Fund (62 percent) must first go toward any existing debt repayment from state highway bonding and is then divided among operations and maintenance activities and capital improvements on state highways. MnSHIP only considers the revenue available for capital improvements.
Figure 2-1: Revenue Sources
Impact of Transportation Bonds on MnDOT's Revenues
In addition to the four main sources of funding, Minnesota also sells transportation bonds to support highway improvements. However, bonds should be understood as a financing approach, as they must be repaid with interest. For example, a series of transportation bonds were authorized in Minnesota Laws of 2008, Chapter 152 (also known as the “Chapter 152 Bridge Investment Program”) for $1.2 billion in bridge improvements on the state highway system through 2018. To repay its Chapter 152 bonds, Minnesota currently has a 3.5 cent per gallon surcharge on top of its 25 cent per gallon gas tax rate.
More recently, the Legislature authorized $300 million in bonds through the Corridors of Commerce program. In the absence of any new, non-bond revenue, the bonds have to be repaid, with interest, from the $21 billion in revenue available for MnSHIP.
The primary purpose of these and other transportation bonds is to enable MnDOT to accelerate the delivery of projects and avoid construction cost increases due to inflation. While bonding is an important financing tool, there are practical limits to using debt to fund transportation improvements. MnDOT’s current policy is to allow no more than 20 percent of annual state revenues to go toward debt repayment. MnDOT is currently near the highest allowable bond repayment level, reaching close to $240 million, or 17.5 percent during its highest year in 2018 before declining over the next 10 to 15 years. Minnesota state law requires MnDOT to make its annual debt repayments prior to making any other investments. Any potential bonding that comes after the adoption of this plan is not reflected in the investment direction set forth by MnSHIP.
20-Year Revenue Projection
During the next 20 years, MnDOT estimates that $21 billion in revenue will be available for capital investment on the state highway system – approximately $1 billion per year. This estimate assumes that no new major sources of revenue will be introduced and that the majority of MnDOT’s future revenues will originate from the four main revenue sources shown in Figure 2-1.
MnDOT anticipates that the actual amount of funding it receives from the State Trunk Highway Fund will increase by approximately 2 percent per year over the next 20 years. However, two key trends will make it increasingly difficult for MnDOT to sustain current conditions on the state highway system:
Figure 2-2: Anticipated Construction Revenue by Year Including Adjustments for Inflation
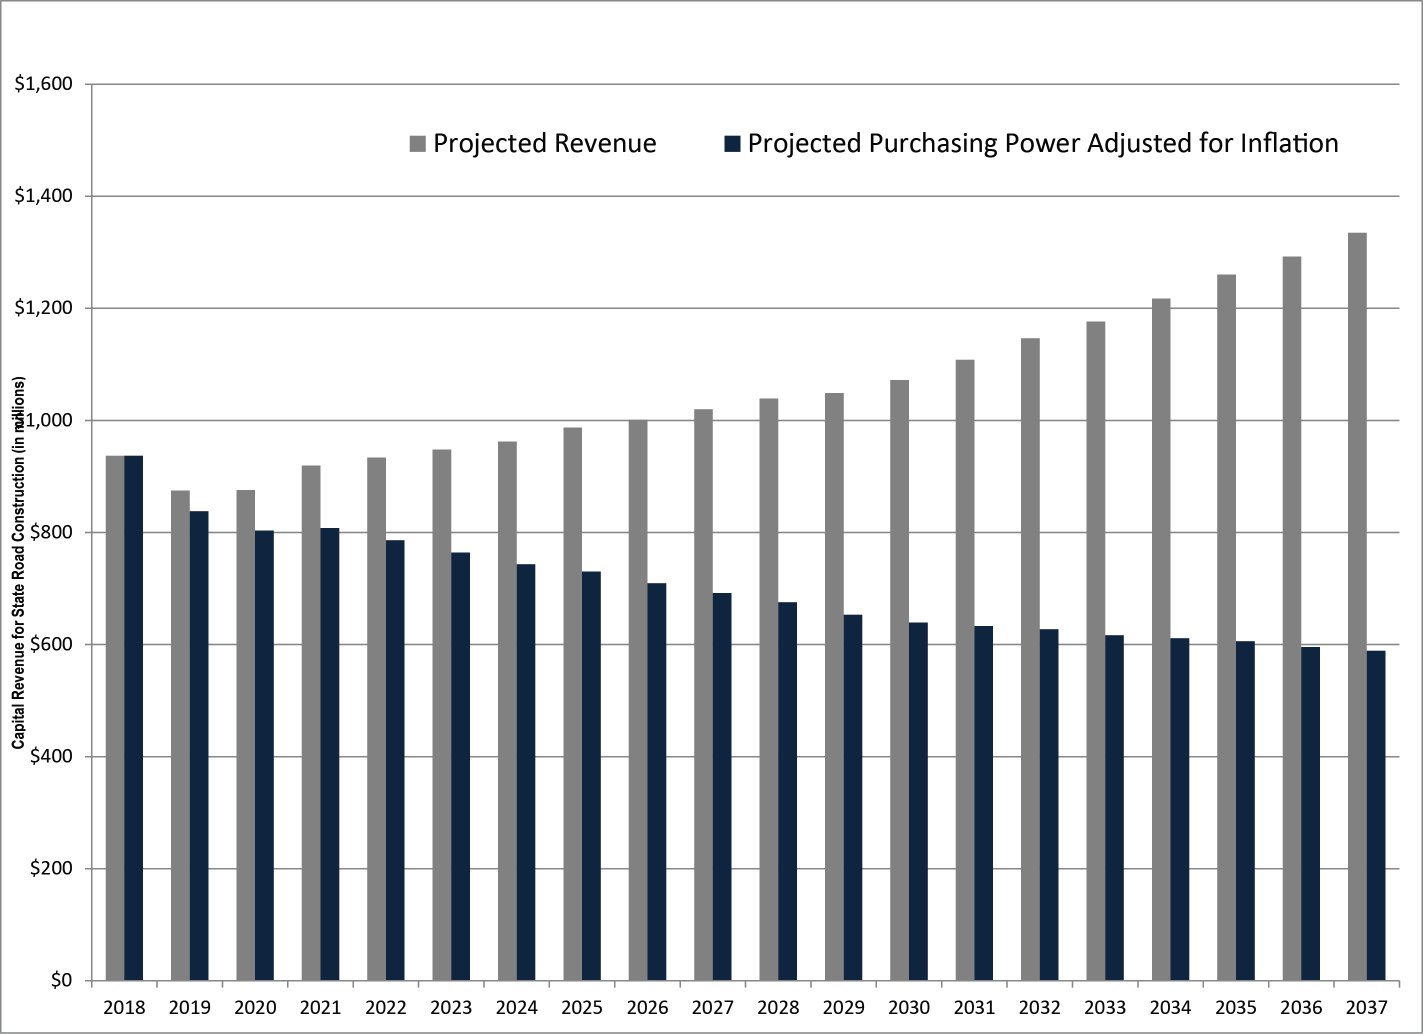
Construction costs are growing more quickly than revenues. Expected revenues will lose buying power over time as construction costs (e.g., fuel, raw materials, equipment and labor) continue to grow at an annual rate of approximately 4.5 percent—a slight tapering off from the past decade—exceeding the annual revenue growth rate of approximately 2 percent (see Appendix E: Financial Summary). This imbalance was also a factor in the 2013 Minnesota State Highway Investment Plan, and is expected to persist as a long-term planning challenge. Figure 2-2 illustrates the impact of 4.5 percent inflation on annual buying power (blue) versus nominal revenues (grey) in future years of construction. The net effect is that inflation will erode over half the buying power of revenues by 2037, given the assumptions stated above.
- Revenue growth continues to be slow. There are several explanations for why MnDOT expects revenues to grow more slowly between 2018 and 2037 as compared to previous years. These include:
- Vehicle fuel efficiency is improving. Minnesotans, as well as Americans in general, are driving more fuel-efficient vehicles and consuming less gasoline. Increased fuel efficiency has been required by the federal government through the Corporate Average Fuel Economy program. While improved fuel economy means lower vehicle air pollutant emissions and a positive impact on the environment, improved fuel economy also means fewer gas taxes collected, and the gas tax is one of the major sources of both federal and state revenue for transportation.
- Increase in hybrid and electric vehicles. Due to advances in engine and battery technologies, hybrid and electric vehicles are becoming more popular. These vehicles, whose lowered emissions are more environmentally friendly, consume less or no fuel. As a result, they contribute fewer revenues toward the State Trunk Highway Fund.
- People are driving about the same distance. There was significant growth in the number of miles traveled on the highway system in the 1990s and early 2000s; however, this growth leveled off in 2004. While per capita VMT remains about the same, total VMT has shown a slight increase in the past couple of years. Total VMT is still expected to continue to increase along with economic and population growth over the next 20 years, but per capita VMT is projected to remain relatively flat due to demographic, technological and behavioral changes. As a result, state motor fuel excise taxes will grow but not drastically. Federal-aid revenues, based on motor fuel excise taxes and transfers from the U.S. General Fund, are also expected to grow slowly over the next 20 years; increases in recent years are far less than decades past.
Federal Law
A new federal surface transportation bill, FAST Act, was signed into law on Dec. 4, 2015. It authorized approximately $305 billion in federal funding for fiscal years 2016 through 2020 in federal funding for transportation projects. Minnesota’s apportioned amount is consistent with the previous federal surface transportation bill, Moving Ahead for Progress in the 21st Century. The FAST Act continues many of the requirements first established in MAP-21, including the use of performance measures and emphasizing investment on the NHS.
The requirements in the FAST Act will affect MnDOT, as well as MnDOT’s transportation partners, in several ways. Appendix F: Federal and State Legislative Requirements details the role the Statewide Multimodal Transportation Plan and MnSHIP have in addressing the requirements in FAST Act.
Impact of the FAST Act on MnSHIP
- Requires states to make progress toward nine national goals for the National Highway System. The national goal areas are (1) safety, (2) infrastructure condition, (3) congestion reduction, (4) system reliability, (5) freight movement and economic vitality, (6) environmental sustainability, (7) reduced project delivery delays, (8) improved resiliency and reliability of the transportation system and reduction or mitigation of stormwater impacts of surface transportation, and (9) enhancement of travel and tourism
- Requires states to adopt a long-range 20-year statewide transportation plan. The plan must use a performance-based approach to transportation decision-making to support the national goals. For MnDOT, MnSHIP is the plan that meets this requirement.
- Focuses performance requirements on the NHS. The FAST Act continues MAP-21’s focus on managing the NHS to a higher level to make sure federal revenue is being used to meet national goals. It authorizes USDOT to establish performance measures to ensure progress toward the nine national goal areas. The legislation sets the target for NHS bridges in poor condition and USDOT will set targets for interstate pavement condition. States will set performance targets for most measures in coordination with Metropolitan Planning Organizations and providers of public transportation. MPOs are federally designated transportation planning organizations in urbanized areas over 50,000. A single effective date for finalizing all federal performance measures is expected in late 2016. States will adopt targets in coordination with MPOs within one year after final rulemaking and MPOs will adopt targets within 180 days after states.
- Creates a program to fund freight projects. Perhaps the biggest change stemming from the FAST Act is a dedicated source of $12 billion in federal dollars for the National Highway Freight Program. Funds under this program are distributed to the states by a formula, and must be used for eligible projects that improve the efficient movement of freight across the National Highway Freight Network. The program is directed towards the highway network; however, up to 10 percent of the funds each state receives can be used for public or private freight facilities such as rail, water and intermodal facilities. Minnesota will receive approximately $20 million a year for this program.
State Requirements
State policy and legislative requirements had a strong influence on the development of MnSHIP. State legislative requirements for MnSHIP are contained in Minnesota Statutes, section 174.03.
In addition to state legislative requirements, state performance requirements were a key factor for MnSHIP. In 2001, Minnesota adopted the Government Accounting Standards Board Statement 34financial reporting requirements for the value and condition of its major infrastructure assets. One of the primary purposes of GASB 34 is to demonstrate to the public, and others, that the agency is maintaining its infrastructure in an acceptable condition and does not have any undisclosed liabilities looming in the future.
MnDOT is also responsible for carrying out programs initiated by the Minnesota State Legislature for projects on the state highway system, such as Corridors of Commerce.
Impact of State Requirements on MnSHIP
- State Legislative Requirements. In 2010, state law defined requirements for the creation of a statewide highway 20-year capital investment plan (i.e., MnSHIP).The law required MnDOT to create a fiscally constrained, performance-based 20-year capital investment plan for the state highway system every four years. As part of the capital investment plan, MnDOT must analyze and track the effect of recent investments, identify needs, establish priorities for projected revenue, and identify strategies to ensure the efficient use of resources. State legislative requirements specific to MnSHIP, and the MnSHIP chapter in which they are addressed, are presented in Figure 2-3.
- State Performance Requirements. MnDOT reports to GASB by measuring the average pavement condition and bridge condition on the state highway system. Without additional revenues and investment, it is expected that by the end of MnSHIP (2037), pavement conditions will fall below the GASB thresholds. Allowing the state’s assets to deteriorate beyond these thresholds could increase the cost of borrowing money for all state and local units of government in Minnesota, as the condition of those assets influences the bond rating of the entire state—not just that of MnDOT. In addition, system conditions falling below GASB 34 thresholds would indicate that other adverse outcomes are occurring on state highways, such as pavement failures requiring expensive fixes, more bridges with weight restrictions, and increased travel costs for all users.
Three main improvements were made in this MnSHIP update to further align MnDOT’s capital investment priorities with state legislative requirements. Initially, MnDOT responded by including a list of major projects in the appendix of the 2013 MnSHIP. MnDOT has since created a stand-alone list of planned projects 10 years in advance called the 10-Year Capital Highway Investment Plan. This represents an expanded planning effort, as districts must account for funding uncertainty, limited information on future needs, and unanticipated events that affect the timing and scope of the identified projects. Including this extended plan of projects is a step toward a more transparent, reliable and predictable planning process that enables the public to better understand MnDOT’s decision-making process. This plan allows districts to conduct broader public engagement efforts surrounding projects in all 10 years. It also helps to achieve better transportation outcomes.
Second, MnDOT separated its capital investment projects into 14 investment categories to continue to more accurately track and analyze the effect of investments on performance targets and other agency goals. This expanded approach helped MnDOT establish its state highway investment priorities in a more detailed way. By breaking projects down into different investment categories, MnDOT can more reliably associate the amount of money it spends to achieve specific outcomes and goals of the agency. MnDOT has been tracking its investments in this manner since 2014, MnSHIP also presents information on past investment levels and their associated performance outcomes in this update. Future updates of MnSHIP will incorporate the impact of investment in each category.
Third, MnSHIP summarizes the dollar amount and impact of investments over the past five years on each performance target. The summary will include a comparison of projected costs with actual project costs. Details on this analysis are available in Appendix F: Federal and State Legislative Requirements.
In addition to the state legislative requirements specific to MnSHIP, the Minnesota State Legislature has also identified 16 goals of the state transportation system. These goals have guided the development of MnDOT’s Family of Plans. Appendix F: Federal and State Legislative Requirements includes a table that lists each goal and its connection to the Minnesota GO Vision, the Statewide Multimodal Transportation Plan, and MnSHIP.
Figure 2-3: Chapters in MnSHIP Addressing Legislative Requirements for MnSHIP
| Minnesota Statutes for MnSHIP (Section 174.03, Subd. 1c) | Location in MnSHIP |
|---|---|
| Incorporates performance measures and targets for assessing progress and achievement of the state’s transportation goals, objectives and policies identified [in this statute] for the state trunk highway system and those goals, objectives and policies established in the Statewide Multimodal Transportation Plan. | |
| Summarizes trends and impacts for each performance target over the past five years. | |
| Summarizes amount and impact of investments over the past five years on each performance target, including a comparison of prior plan projected costs with actual costs. |
|
| Identifies the investments required to meet the established performance targets over the next 20-year period. | |
| Projects available for state and federal funding over the 20-year period, including any unique, competitive, time-limited, or focused funding opportunities. | |
| Identifies strategies to ensure the most efficient use of existing transportation infrastructure, and to maximize the performance benefits of projected available funding. | |
| Establishes investment priorities for projected funding, including a schedule of major projects or improvement programs for the 20-year period together with projected costs and impact on performance targets. |
|
| Identifies those performance targets identified under clause (1) not expected to meet the target outcome over the 20-year period together with alternative strategies that could be implemented to meet targets. |
MnDOT Policy
MnSHIP is one of MnDOT’s system investment plans and is a member of MnDOT’s Family of Plans. The Minnesota GO Vision and the Statewide Multimodal Transportation Plan provide over-arching guiding principles and objectives for transportation in Minnesota. The system investment plans use the guiding principles, objectives and strategies from the Minnesota GO Vision and Statewide Multimodal Transportation Plan to guide investment decisions on the various transportation systems that MnDOT oversees.
Minnesota GO Vision and Statewide Multimodal Transportation Plan
The Minnesota GO planning framework starts with the Minnesota GO Vision. Adopted in 2011, the Vision established eight guiding principles to move toward a multimodal transportation system that maximizes the health of people, the environment and the economy. These principles are to be used collectively and are intended to guide policy and investment direction.
Figure 2-4: Minnesota GO Guiding Principles
| Minnesota GO Guiding Principles |
|---|
| Leverage public investments to achieve multiple purposes. The transportation system should support other public purposes, such as environmental stewardship, economic competitiveness, public health and energy independence. |
| Ensure accessibility. The transportation system must be accessible and safe for users of all abilities and incomes and provide access to key resources and amenities. |
| Build to a maintainable scale. Consider and minimize long-term obligations – do not overbuild; reflect and respect the surrounding physical and social context. |
| Ensure regional connections. Key regional centers need to be connected to each other through multiple modes of transportation. |
| Integrate safety. Systematically and holistically improve safety for all forms of transportation; be proactive, innovative and strategic in creating safe options. |
| Emphasize reliable and predictable options. The reliability of the system and predictability of travel time are frequently as important as or more important than speed. |
| Strategically fix the system. Some parts of the system may need to be reduced while other parts are enhanced or expanded to meet changing demand. |
| Use partnerships. Coordinate across sectors and jurisdictions to make transportation projects and services more efficient. |
The Statewide Multimodal Transportation Plan was updated in combination with MnSHIP. It identified objectives and strategies in five policy areas to make progress toward the Vision. The plan focused on multimodal solutions that ensure a high return-on-investment. The objectives and strategies are listed in no particular order and all are critical focus areas for the upcoming years. More information on these policy links can be found in Appendix F: Federal and State Legislative Requirements.
Figure 2-5: Statewide Multimodal Transportation Plan Objectives
| Statewide Multimodal Transportation Plan Objectives |
|---|
| Open Decision Making. Make transportation system decisions through processes that are inclusive, engaging, and supported by data and analysis. Provide for and support coordination, collaboration and innovation. Ensure efficient and effective use of resources. |
| Transportation Safety. Safeguard transportation users as well as the communities the systems travel through. Apply proven strategies to reduce fatalities and serious injuries for all modes. Foster a culture of transportation safety in Minnesota. |
| Healthy Communities. Make fiscally responsible decisions that respect and complement the natural, cultural, social and economic context. Integrate land uses and transportation systems to leverage public and private investments. |
| Critical Connections. Maintain and improve multimodal transportation connections essential for Minnesotans’ prosperity and quality of life. Connections should help achieve progress in meeting performance measures and targets and to maximize social, economic and environmental benefits. Strategically consider new connections. |
| System Stewardship. Strategically build, manage, maintain and operate all transportation assets. Rely on system data and analysis, performance measures and targets, agency and partners’ needs and public expectations to inform decisions. Use technology and innovation to get the most out of investments and maintain system performance. Increase the resiliency of the transportation system and adapt to changing needs. |
Complete Streets
MnDOT incorporates a complete streets approach as part of every project delivered. On all projects, MnDOT evaluates and balances the needs of all users (pedestrians, bicyclists, freight, transit, motor vehicles, etc.) during planning, scoping, design, construction, operations and maintenance of the state highway network. Project development analysis includes the access and mobility needs of user groups moving both along state highways and crossing state highways. The objective is not all modes on all roads, but rather interconnected and integrated networks for all users. Districts must evaluate opportunities to address the needs of all users both at the individual project level and when developing Statewide Transportation Improvement Programs and 10-Year Capital Highway Investment Plans.
Performance Measures Policy
MnDOT formally adopts performance measures and targets through public planning processes or through review and approval by designated management groups. The MnSHIP planning process is one of the methods of adopting measures and targets. The measures included in this document are the formally adopted measures and targets for their associated investment category. MnDOT carefully considers existing commitments, relative priorities and tradeoffs when adopting or modifying performance measures and targets.
All adopted performance measures and corresponding targets are included in the list of formally adopted performance measures and targets available on the MnDOT Performance Measures website.
Priority Network
MnDOT realized the importance federal legislation placed on managing and maintaining NHS roadways to higher standard and officially made it the state’s priority highway network in summer 2015. The rationale for designating the NHS as the priority highway network included:
- Federal legislation requires performance measurement on the NHS.
- MnDOT’s Freight Plan analyzed six different networks and identified NHS roadways as the priority freight network based on usage and flows.
- The NHS was used in the 2013 MnSHIP as a primary network for investing in pavements and bridges.
- Performance measures on the NHS are federally required.
Defining the NHS as the priority network allows MnDOT to better communicate the agency’s work to the public while investing in roadways that carry the majority of vehicle trips.
Current System Conditions and Long-Term Trends
The state highway system is a large and aging network. It requires a mix of maintenance and capital investments in order to keep the system in a state of good repair. MnDOT actively seeks to minimize costs over the life of its assets through maintenance and capital investments. In particular, MnDOT’s pavements face a growing need for reconstruction over the life of the plan.
Since the early 1990s, MnDOT has used performance measurement to evaluate its services and to guide its plans, projects and investments. MnDOT tracks the condition of the state highway system and publishes this information in its Annual Minnesota Transportation Performance Report.
Historically, MnDOT has set targets designed to achieve optimal or desired performance levels in particular investment categories. These targets have typically been based on lowest life-cycle costs, customer expectations or a policy priority. Others have been trend-based – set by looking at trends and outcomes associated with historical spending levels. More recently, MnDOT has established targets that it determines to be an acceptable risk, such as those targets identified for roadside infrastructure assets. While MnDOT continues to use some of these targets to estimate its investment needs, the current and projected future funding reality has made many performance targets such as NHS pavements and many roadside infrastructure components, unachievable in most cases.
The following sections describe the current conditions and long-term trends for each MnSHIP investment category.
System Stewardship: Conditions and Trends
Pavement Condition
Pavement deterioration is a serious risk facing MnDOT’s state highway system – more than half of its pavements were constructed 50 or more years ago. MnDOT measures pavement conditions by tracking the percentage of Interstate, Other NHS, and non-NHS in good and poor condition. Targets for NHS and non-NHS pavement condition are used to calculate needs (see Chapter 3: Investment Needs). MAP-21 and the FAST Act require MnDOT to assess NHS pavement conditions with yet-to-be finalized measures (and targets for Interstates) set by USDOT.
As shown in Figure 2-6, the percentage of pavements in poor condition remained steady from 2014 to 2015, following a four year trend of improving pavement quality statewide. Overall, 3.7 percent (500 miles) of state highway miles were in poor condition in 2015, compared to 6.6 percent in 2011. The percentage of poor condition pavements varies between the three different types of state highway roads:
- Interstate pavements: 2.1 percent poor (39 miles), 74.5 percent good (1,383 miles)
- Other NHS pavements: 2.7 percent poor (155 miles), 71.5 percent good (4,104 miles)
- Non-NHS pavements: 5.1 percent poor (341 miles), 66.2 percent good (4,426 miles)
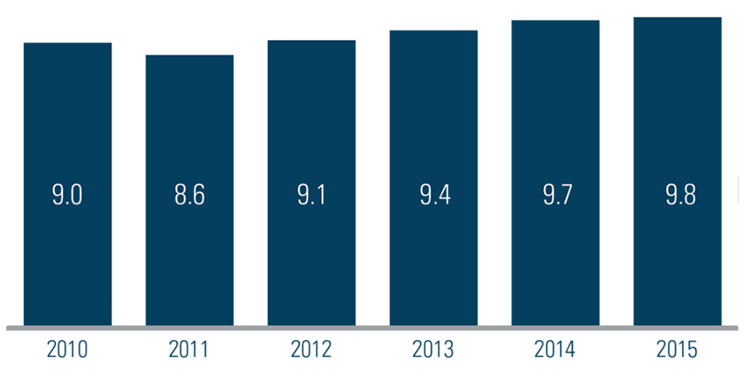
Overall, the average remaining service life of all state highway pavements has increased slightly over the past six years as shown in Figure 2-7.
Figure 2-6: Percentage of Pavement Miles on State Highway System in Poor Condition
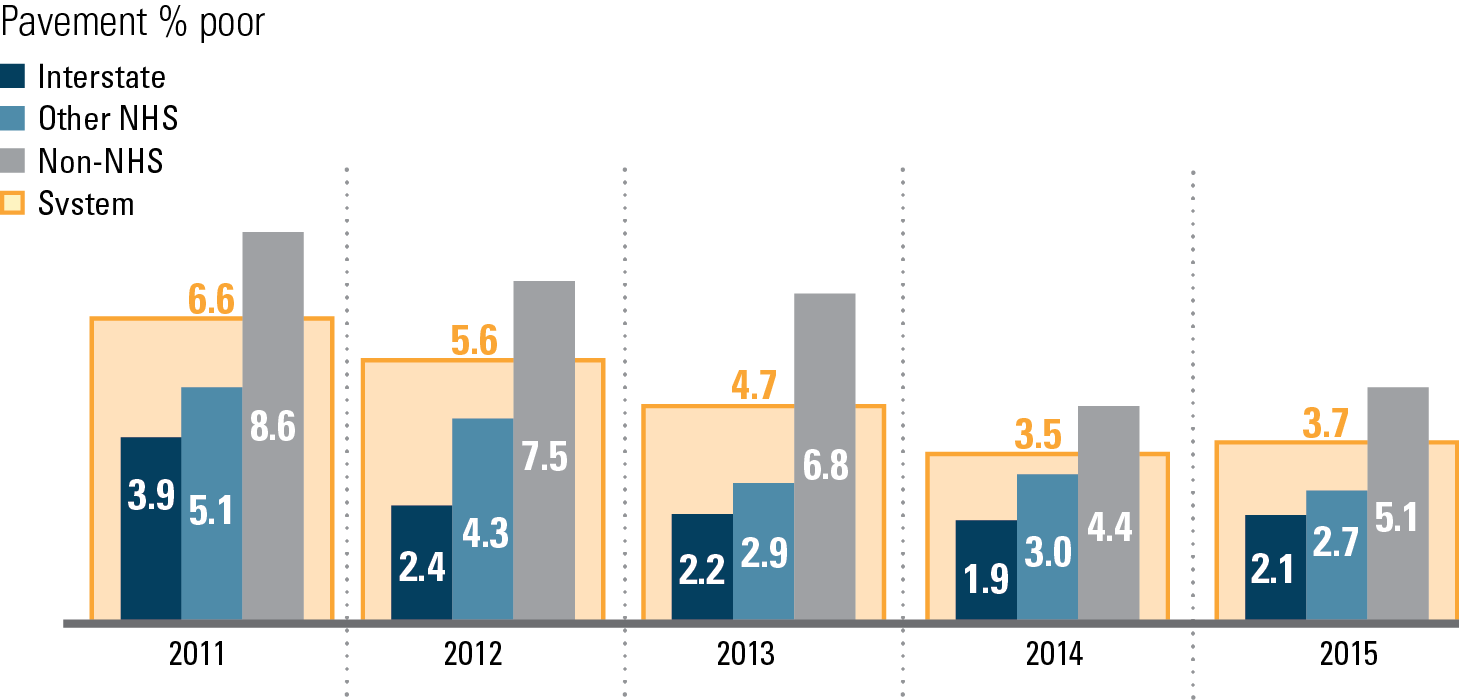
Figure 2-7: Average Remaining Service Life in Years (all state highways)
Bridge Condition
MnDOT is committed to a regular schedule of condition assessment and preventive maintenance to keep its bridges in good condition. Approximately 35 percent of MnDOT’s bridges are more than 50 years old. Like state highway pavements, aging bridges require more costly improvements to be maintained in serviceable condition.
MnDOT measures its performance in Bridge Condition by reporting on the percent of deck area in poor condition through regular inspections. The condition measure includes ratings of the deck, the substructure and the superstructure evaluations of bridges on the state highway system. MnDOT set a goal that the share of NHS bridges in good structural condition should be 55 percent and those in poor structural condition should be 2.0 percent or less, measured by deck area. Bridges rated as being in poor condition are safe to drive on, but are approaching the end of their useful lives. Structurally unsafe bridges are closed promptly.
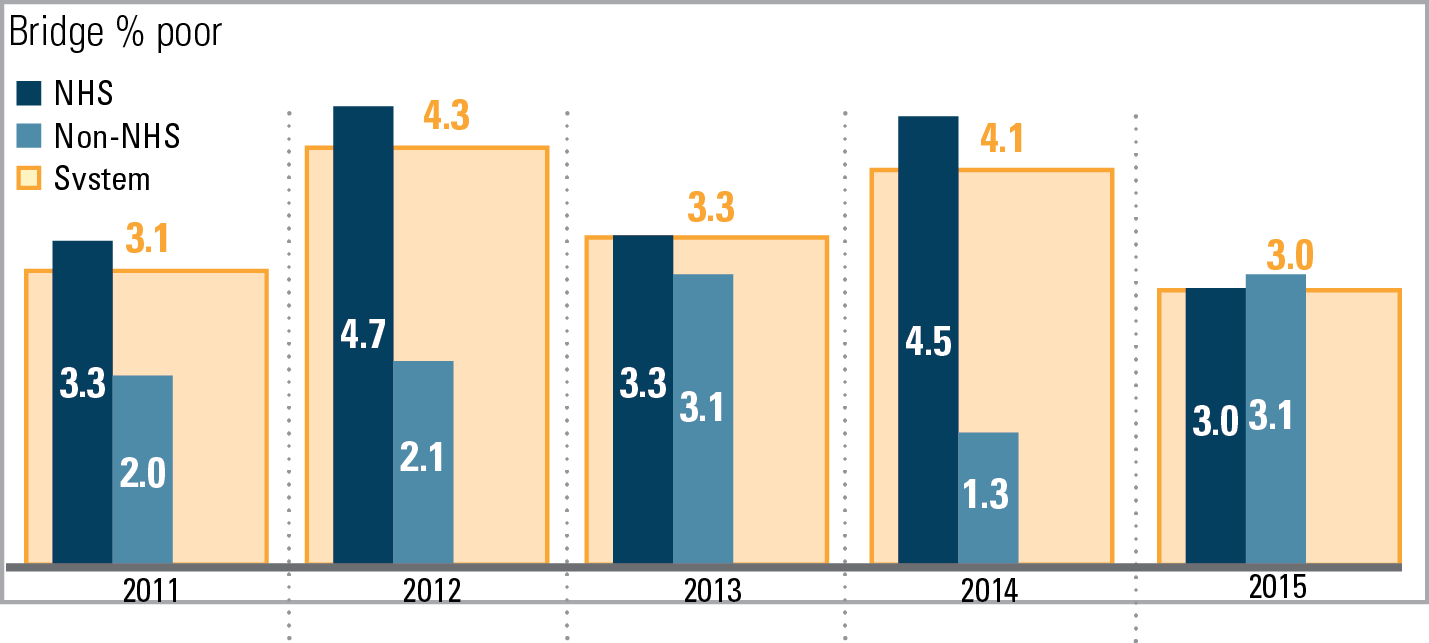
MnDOT is not currently meeting its target for NHS bridges in poor condition but is meeting targets for non-NHS bridges, as shown in Figure 2-8. As of 2015, the percent of NHS bridges in poor condition (3.0 percent) exceeded the maximum target of 2.0 percent poor but improved from a high of 4.7 percent poor in 2012.
Figure 2-8: Percent of Bridge Deck Area in Poor Condition
Roadside Infrastructure Condition
MAP-21 required states to develop a risk-based Transportation Asset Management Plan for pavements and bridges on the NHS to improve or preserve asset condition and the performance of the system. MnDOT elected to expand the TAMP beyond the MAP-21 requirements and include all state-owned roads and bridges as well as highway culverts, deep storm water tunnels, overhead signs and high-mast light towers. Since completion of the TAMP, MnDOT has expanded asset management planning to other roadside infrastructure - highway lights, intelligent transportation systems, noise walls and signals. Both efforts identified performance measures and targets for assets not identified in federal legislation or the 2013 MnSHIP. These assets are included in this MnSHIP update. Additionally, the related infrastructure condition performance measures and targets will become part of MnDOT’s formally adopted measures and targets. Performance for many roadside infrastructure assets is identified as part of an inspection process and typically measured by condition or age.
The TAMP process included an accurate assessment of current conditions for culverts, deep storm water tunnels and overhead sign structures. State owned culverts are at 10 percent poor, while 24 percent of deep storm water tunnels are in poor condition and 30 percent of overhead sign structures are in poor condition.
Currently, MnDOT is able to address some of its roadside infrastructure needs as components of other projects. However, MnDOT has not been able to fix most assets at optimal points in their life cycles under the current investment program. Roadside infrastructure conditions will likely deteriorate unless additional investments are made.
Facilities Condition
Facilities Condition is a new investment category. It includes all 52 MnDOT-owned rest areas and 10 weight enforcement operational buildings and weigh scales. The Facilities investment category does not include buildings such as district headquarters or other operational facilities. In 2015, MnDOT completed an assessment of all agency-owned facilities. The assessment will help guide the development of performance measures and targets for facilities that don’t currently have them. Performance for rest areas is based on the physical condition of the building and surrounding pavement and is ranked on a scale between excellent/good to extremely poor/beyond service life. Currently, the assessment determined that six percent of state owned rest areas were in good to excellent condition. At the current level of investment, nearly half of rest areas will be beyond their service life by the end of the plan, potentially resulting in the closure of rest areas. Weigh scales will also become outdated or closed, making it more difficult to enforce weight restrictions.
Jurisdictional Transfer
MnDOT does not currently measure performance in Jurisdictional Transfer. As part of the recently completed Minnesota Jurisdictional Realignment Study, MnDOT identified segments of road that could potentially be transferred based on ease of transfer. The study established a goal of reassigning jurisdiction of 1,181 miles of road. At the current rate, the goal will be achieved by 2080. During the past 10 years, MnDOT has transferred 170 miles of state highway roads primarily to counties. An average of 17 miles are transferred each year resulting in road improvements for communities throughout the state. Investment in Jurisdictional Transfer will allow MnDOT to continue to work with our local government partners to agree on and commit to additional roadway transfers that would align the travelers expectations of the facility with the proper level of investment and also lower future maintenance and capital costs to MnDOT.
Transportation Safety: Conditions and Trends
Traveler Safety
MnDOT tracks total traffic fatalities and serious injuries from vehicle crashes. MnDOT uses targets set by the Toward Zero Deaths program to measure its progress in Transportation Safety. MnDOT aims to help the state reach 300 or fewer fatalities and 850 or fewer serious injuries by 2020.
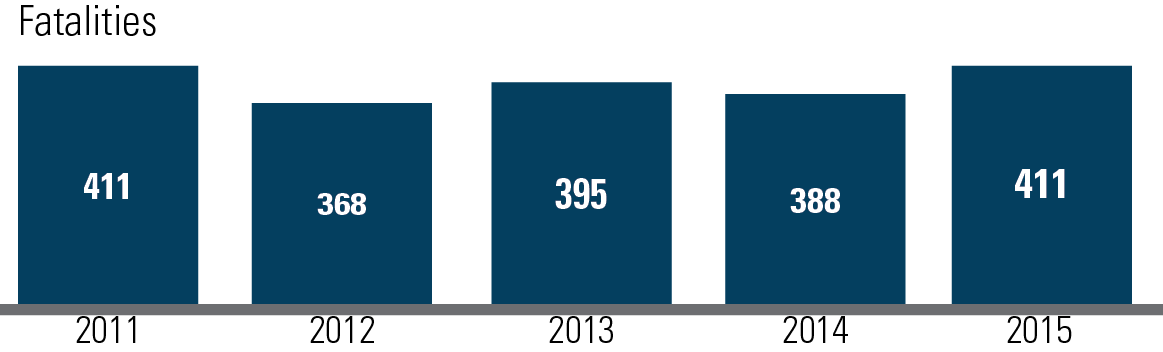
On an average day in 2015, at least one person died on Minnesota highways (411 deaths total [see Figure 2-9]). This vehicle crash-related fatality total is above the statewide Toward Zero Deaths goal of fewer than 300 deaths per year. With 1,127 serious injuries in 2015, Minnesota was below the TZD target of 1,200 or fewer serious injuries. After steep declines in fatalities at the end of the last decade, traffic- and bicycle-related fatalities have remained constant since 2011 while pedestrian and motorcycle fatalities saw an increase in 2015.
Figure 2-9: Minnesota Traffic Fatalities on All State and Local Roads
Critical Connections: Condition and Trends
Twin Cities Mobility
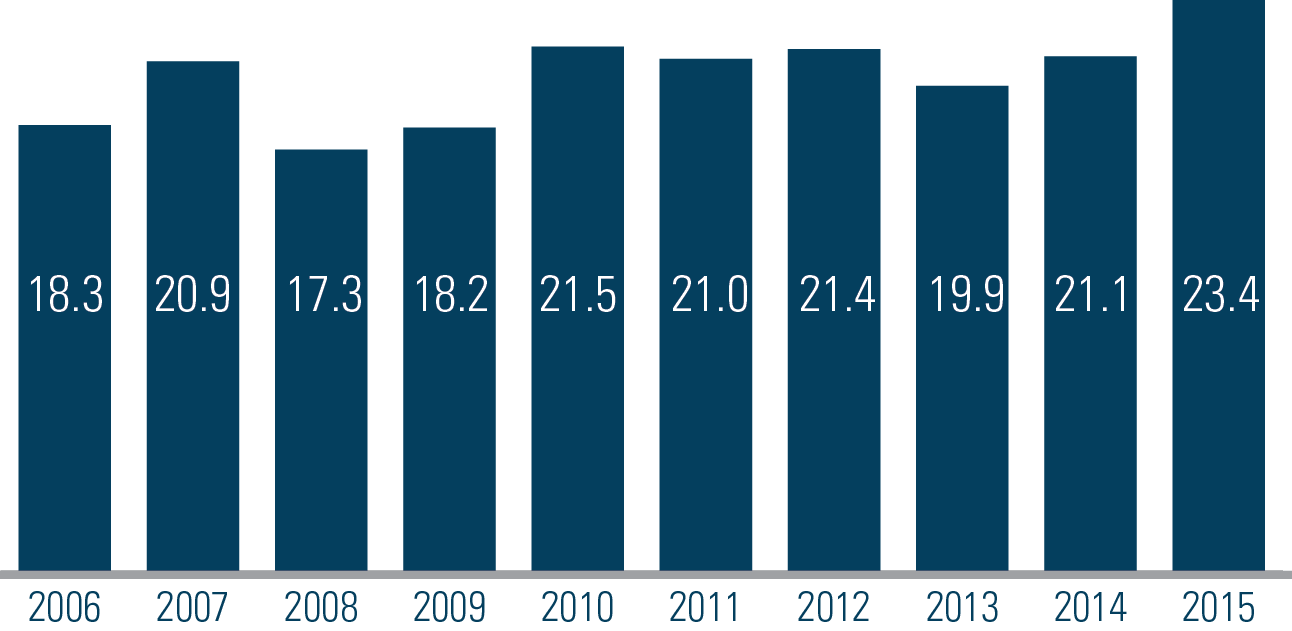
MnDOT tracks congestion on Twin Cities NHS urban freeways by measuring the percentage of miles where vehicles are traveling below 45 miles per hour during morning or evening peak periods (5 to 10:00 A.M. and 2 to 7:00 P.M.). There was a large increase in congestion between 2014 (21.1 percent) and 2015 (23.4 percent). As shown in Figure 2-10, congestion has increased steadily over the last two years. Increased economic activity and forecast population gains could worsen congestion over the plan years.
Figure 2-10: Percent of Congested Urban Freeways in the Twin Cities
MAP-21 requires MnDOT to adopt a system performance measure that advances the national goal of system reliability on the NHS. There is an additional requirement to develop a performance measure related to traffic congestion and on-road mobile source emissions in the Twin Cities metropolitan area. MnDOT will coordinate with the Metropolitan Council and other key stakeholders when it begins the process of developing the target.
Greater Minnesota Mobility
MnDOT anticipates new federal performance measures and targets for mobility to be set for the NHS as a result of MAP-21. A notice of proposed rulemaking has been issued. Once the federal rules have been finalized, MnDOT can begin the process of setting the final targets. During the development of this plan, MnDOT received travel time data from the Federal Highway Administration. In 2015, the majority of the NHS roads in Greater Minnesota performed well with limited delays. Only a few corridors currently experience travel time delay. However, beyond 2021, several corridors could see an increase in travel time delay due to improving economic conditions.
Freight
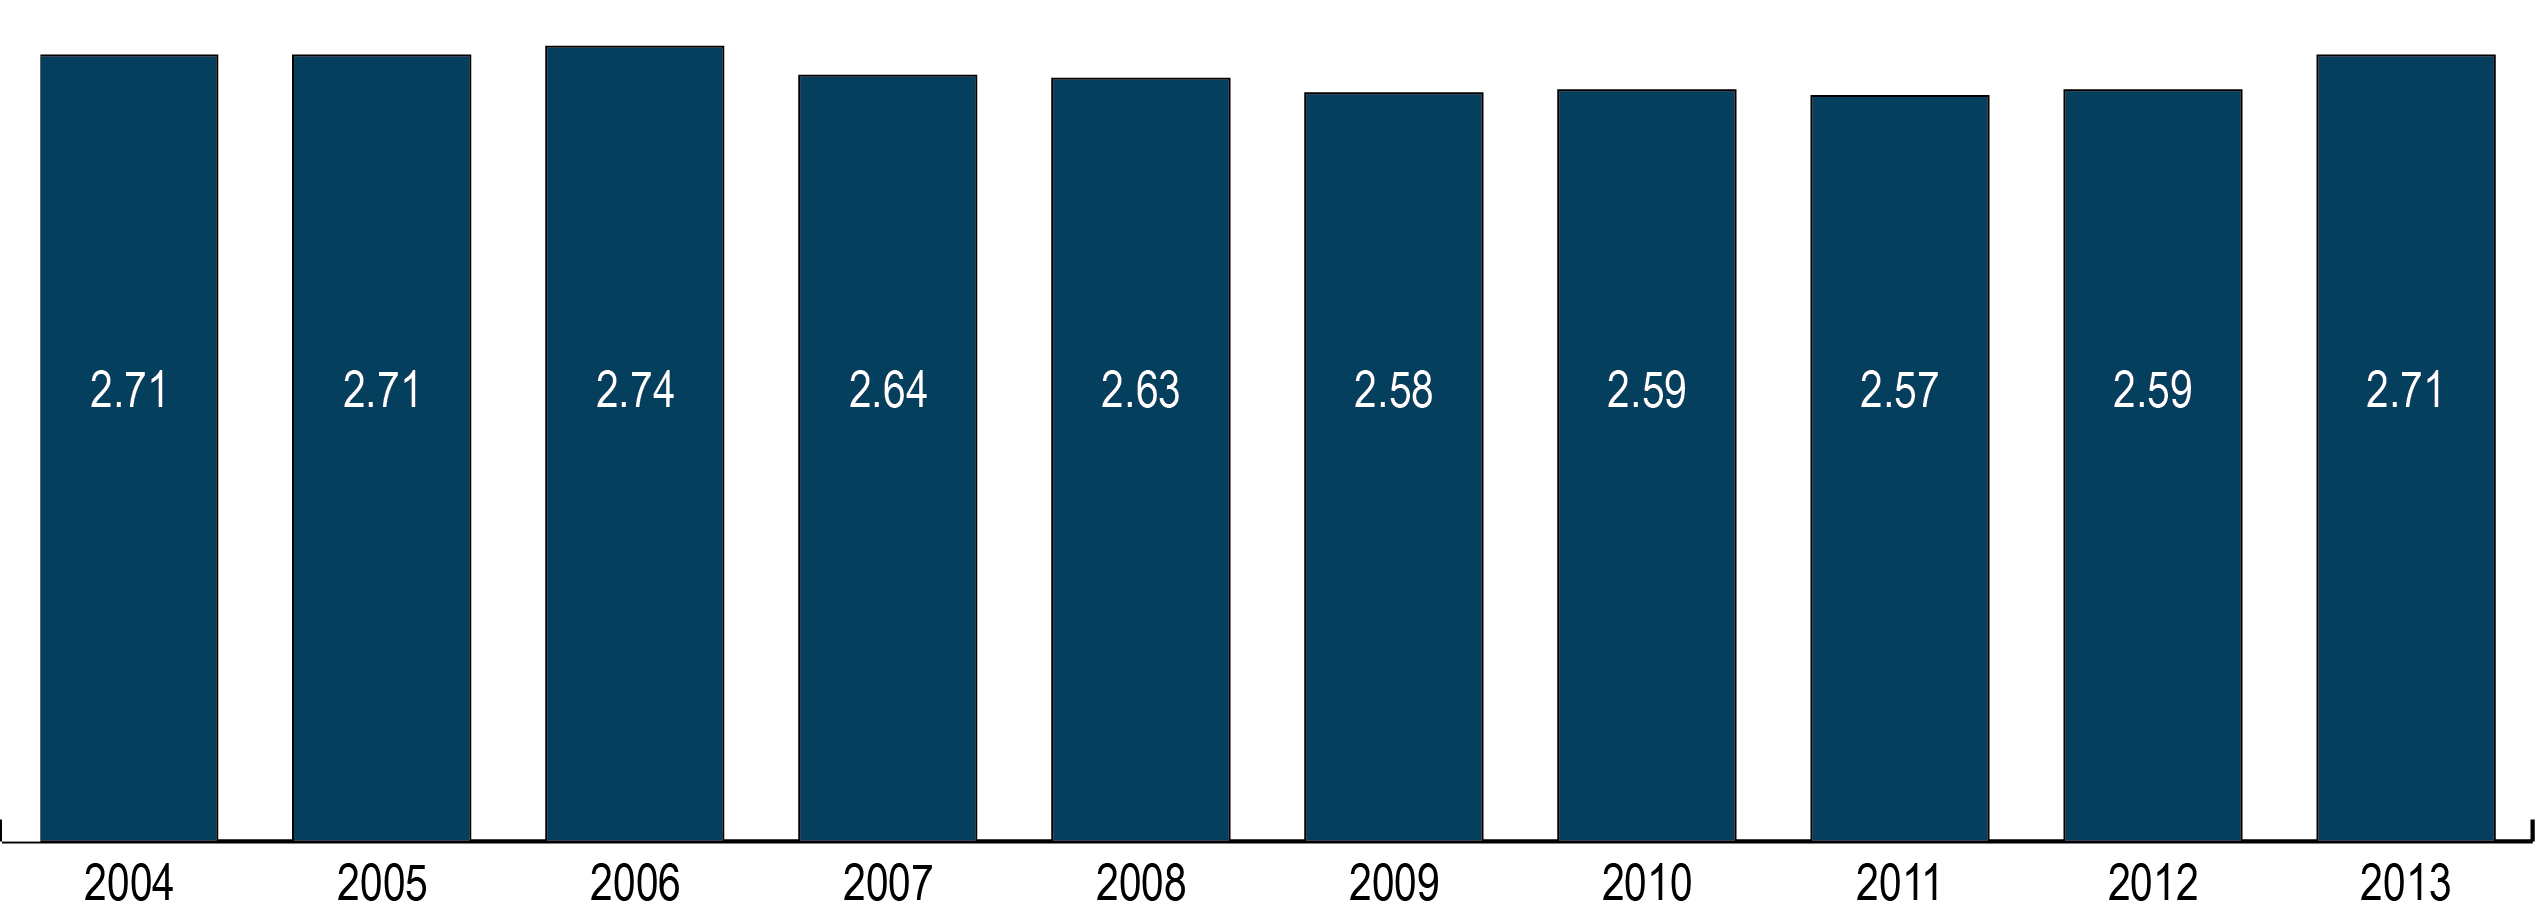
Freight includes the movement of all goods that originate or terminate in Minnesota across all modes. This includes trucks and other heavy commercial vehicles, rails, water ports, pipelines and air transport. Truck-only trips remain the primary means of shipping goods by value, but the share moved by other modes is increasing. 2013 saw in increase in heavy commercial vehicle miles traveled on Minnesota highways, along with an increase in tons of freight shipped through rail (Figure 2-11). The Freight Investment Plan will help identify how the FAST Act Freight Program funds get invested on the new National Highway Freight Network.
Figure 2-11: Heavy Commercial Vehicle Miles Traveled on Minnesota State Highways 2004-2013 (billions)
Bicycle Infrastructure
MnDOT invests approximately 2 percent of pavement project costs and approximately 3 percent of bridge project costs, toward Bicycle Infrastructure improvements. While MnDOT does not currently measure statewide progress toward any specific performance measures related to bicycle facilities, it does track bicycle commuting trips within Minnesota’s six most populous cities. While there was a drop in bicycle commuter trips throughout the state between the historic high of 2013 and 2014, daily bike ridership has remained very consistent since 2006 and once a week ridership has remained relatively steady over the same period.
MnDOT finalized the Statewide Bicycle System Plan that provides direction for integrating bicycling into Minnesota’s transportation network. This includes plans for each of the eight MnDOT districts as well as tools for practitioners to use in selecting facilities to be included in projects. The plan also recommends performance measures to help MnDOT prioritize and coordinate bicycle infrastructure investments on the state highway system.
Accessible Pedestrian Infrastructure
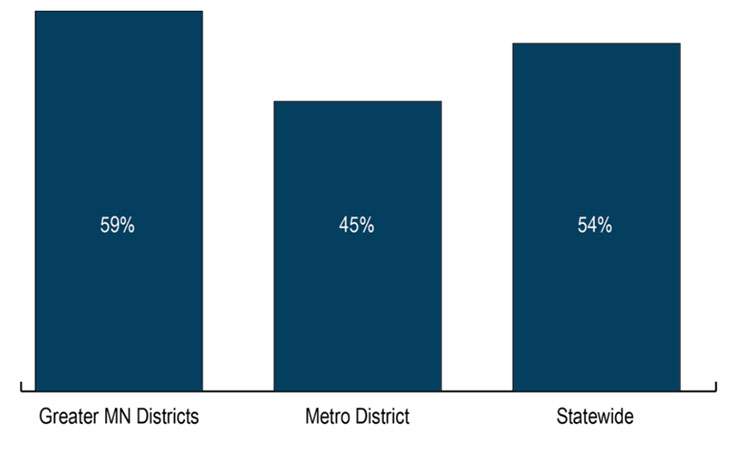
MnDOT uses two performance measures to track progress in Accessible Pedestrian Infrastructure. MnDOT tracks the percent of signalized intersections with accessible pedestrian signals and the percentage of the 620 miles of sidewalks within MnDOT’s right of way that are not compliant with the 1990 Americans with Disabilities Act. MnDOT is making progress toward its goal of equipping all signalized state highway intersections with accessible pedestrian signals by 2030. As of 2014, 36 percent of all intersections had three signals installed, up from 28 percent in 2012. The current percentage of sidewalks that are non-compliant is 54 percent, as shown in Figure 2-12. Sidewalks can be non-compliant for having a narrow width, a steep slope, having barriers or being in poor condition.
Figure 2-12: Percent of State Highway Sidewalk Miles that are Not Compliant with ADA Requirements in 2014
MnDOT also tracks the number of curb ramps that comply with the ADA standards. MnDOT continues to face challenges in achieving its curb ramp accessibility targets due to funding and project timing constraints. Of the more than 21,000 curb ramps inventoried throughout the state, less than half (approximately 10,000) were completely or partially meeting ADA standards. MnDOT’s policy is to replace curb ramps that do not meet ADA requirements in all reconstruction and alteration level projects.
In addition, MnDOT will continue to update its inventory of pedestrian facilities within MnDOT’s right-of-way and to reconstruct sidewalks as part of ADA projects and pavement and bridge projects.
Healthy Communities: Conditions and Trends
Regional and Community Improvement Priorities
MnDOT measures its progress with respect to RCIPs by conducting customer satisfaction studies and consistently seeking input and collaboration opportunities with stakeholders. Beginning in 2010, MnDOT has responded in part to regional concerns and collaboration opportunities through the use of the Transportation Economic Development Program. The program is a joint effort between MnDOT and the Minnesota Department of Employment and Economic Development established to support highway improvement and public infrastructure projects that create jobs and support economic development.
Other: Conditions and Trends
Project Delivery
Project Delivery is critical to ensuring timely and efficient delivery on all projects constructed on the state highway system. While performance is not measured for this category, MnDOT tracks how much it has spent on Project Delivery investments as part of its overall investment program.
Historically, Project Delivery has accounted for approximately 16 percent of MnDOT’s annual capital investment program. However, the Project Delivery percentage changes year-to-year based on the mix of investments it supports. For example, when MnDOT delivers a program that includes a number of expansion projects, it invests more on Project Delivery due to the increased need for right of way purchases and design of more complex projects. When the majority of MnDOT’s program consists of asset preservation projects in settings that are not complex such as rural areas, a smaller percentage of its overall program goes toward Project Delivery. MnDOT strives to reduce the overall need for Project Delivery through innovative design, early project identification and shared services.