
Chapter 2
Existing Conditions and Trends
MnDOT considered or accounted for current conditions, recent and future trends in establishing investment priorities for the state highway system. Some of these trends pose large challenges to both managing the existing infrastructure and making improvements to the system. These challenges include rising construction costs due to inflation, federal and state legislative and performance requirements and a large and aging highway system in need of repair and reconstruction. MnDOT analyzed these and other trends to guide the development of MnSHIP.
What Trends Are Influencing Transportation?
The Minnesota GO 50-Year Statewide Vision and the Statewide Multimodal Transportation Plan identify challenges and opportunities facing Minnesota’s transportation. Because transportation infrastructure can last 50 years or longer, it is important for MnDOT to monitor trends that influence the use and condition of the state’s transportation system. This allows MnDOT to adapt roadway designs and operations as needed. Included in these considerations are:
- Demographic shifts. Minnesota will continue to grow both older and more diverse, with most population growth occurring in metropolitan areas and along the I-94 corridor.
- Logistical evolution. Freight volume will continue to grow with increasing focus on local hubs to ensure timely delivery.
- Aging infrastructure. Minnesota will increasingly need to reconstruct aging infrastructure as pavement, bridges, rails and ports reach the end of their useful life.
- Climate change. The transportation system will face challenges of increased wear from torrential rain and rising temperatures as well the transition away from fossil fuels.
- Safety concerns. After years of decline, deaths of motorists, pedestrians and bicyclists have increased, especially during the pandemic, a reversal that has a particular impact on the state’s Black, Indigenous, and People of Color communities.
- Behavioral changes. Recent years have seen growth in telecommuting, especially during the pandemic. However, the long-term travel behavior of workers remains unknown, and other types of trips may still increase as commutes remain below pre-pandemic levels.
Current System Conditions and Long-Term Trends
The state highway system is a large and aging network. It requires a mix of maintenance and capital investments to keep the system in a state of good repair. MnDOT actively seeks to minimize costs over the life of its assets through maintenance and capital investments. In particular, state highway pavements face a growing need for reconstruction over the life of the plan.
Since the early 1990s, MnDOT has used performance measurement to evaluate its services and to guide its plans, projects and investments. MnDOT tracks the condition of the state highway system and publishes this information in its Annual Minnesota Transportation Performance Report.
Historically, MnDOT has set targets designed to achieve optimal or desired performance levels in particular investment categories. These targets have typically been based on lowest life-cycle costs, customer expectations or a policy priority. Others have been trend-based – set by looking at trends and outcomes associated with historical spending levels. More recently, MnDOT has established targets that it determines to be an acceptable risk, such as those targets identified for roadside infrastructure assets.
The following sections describe the current conditions and long-term trends for each MnSHIP investment category.
System Stewardship: Conditions and Trends
Pavement Condition
Pavement deterioration is a serious risk facing Minnesota’s state highway system – more than half of its pavements were constructed 50 or more years ago. MnDOT measures pavement conditions by tracking the percentage of Interstate, other National Highway System (NHS) and non-NHS pavements in good, fair and poor condition. Targets for NHS and non-NHS pavement condition are used to calculate needs (see Chapter 4: Investment Needs). Federal legislation requires MnDOT to assess NHS pavement conditions and the U.S. Department of Transportation has set a minimum performance threshold for Interstates. Interstate condition in Minnesota is currently meeting the minimum threshold and is not projected to exceed that threshold based on programmed investments.
As shown in Figure 2-1, the percentage of pavements in poor condition have remained low on the Interstate and Other NHS and declined significantly on the non-NHS. Pavement conditions are currently meeting targets on all state highway systems. The current percentage of pavements in poor and good condition varies between the three different types of state highway roads:
- Interstate pavements: 0.5% poor, 92.2% good
- Other NHS pavements: 0.5% poor, 83.1% good
- Non-NHS pavements: 1.0% poor, 77.5% good
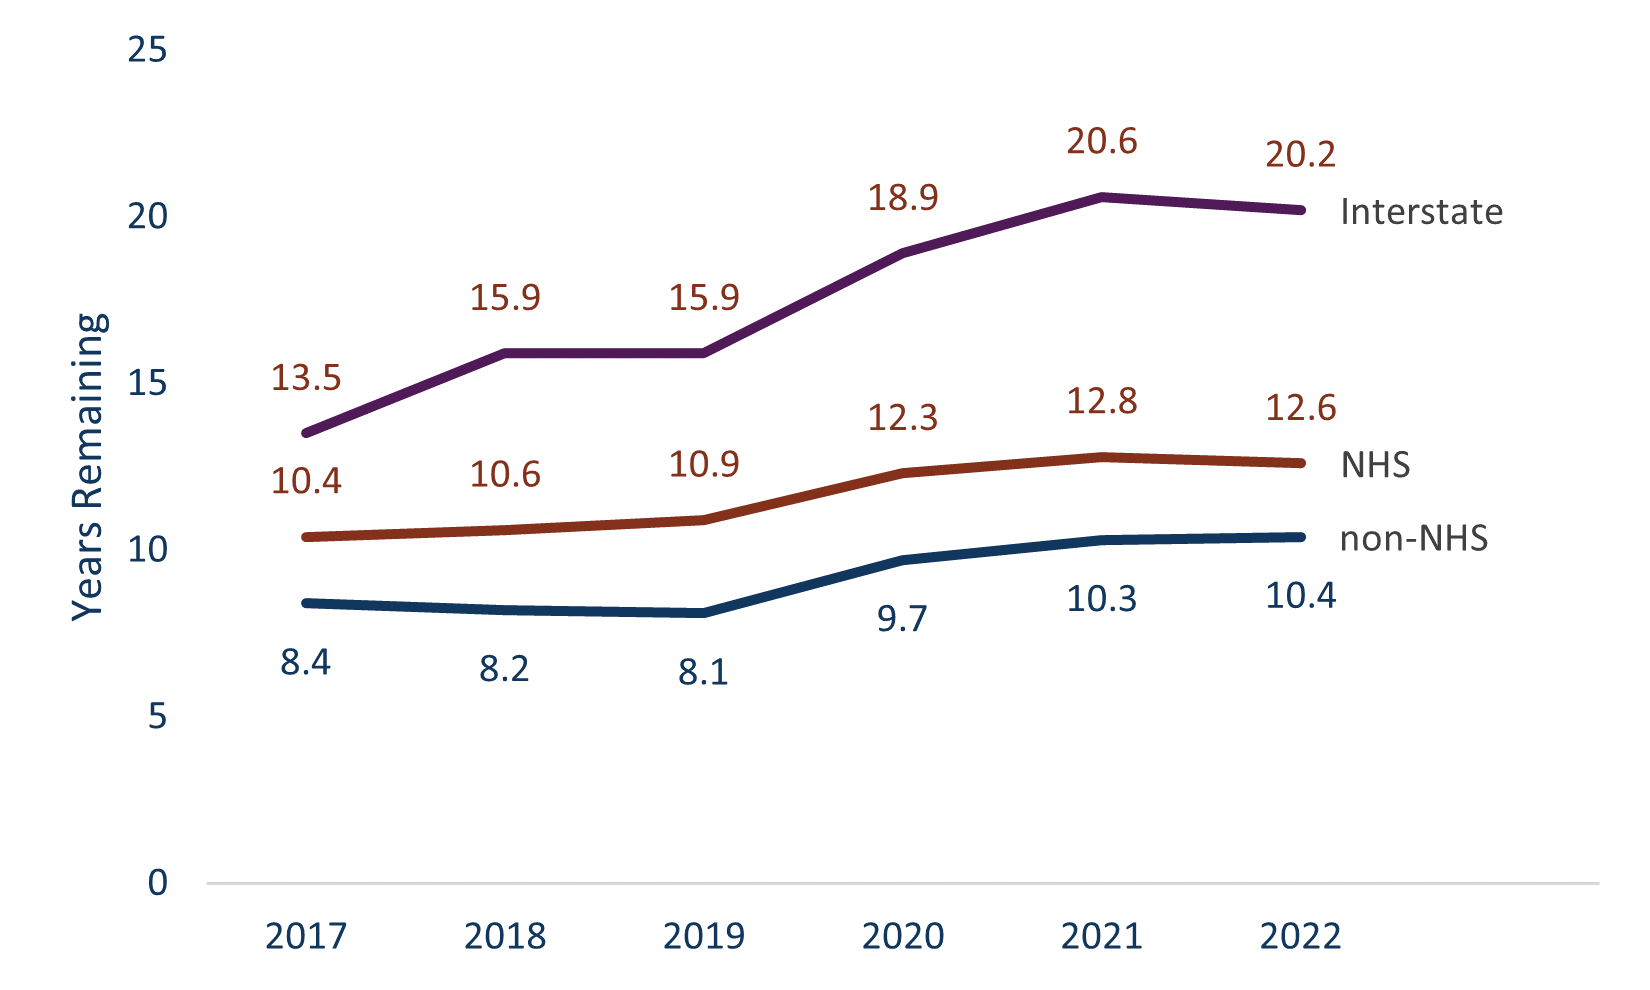
Overall, the average remaining service life1 of all state highway pavements has increased slightly over the past six years as shown in Figure 2-2.
Figure 2-1: Current and Forecast Percent of State Highway Pavement in Poor Condition
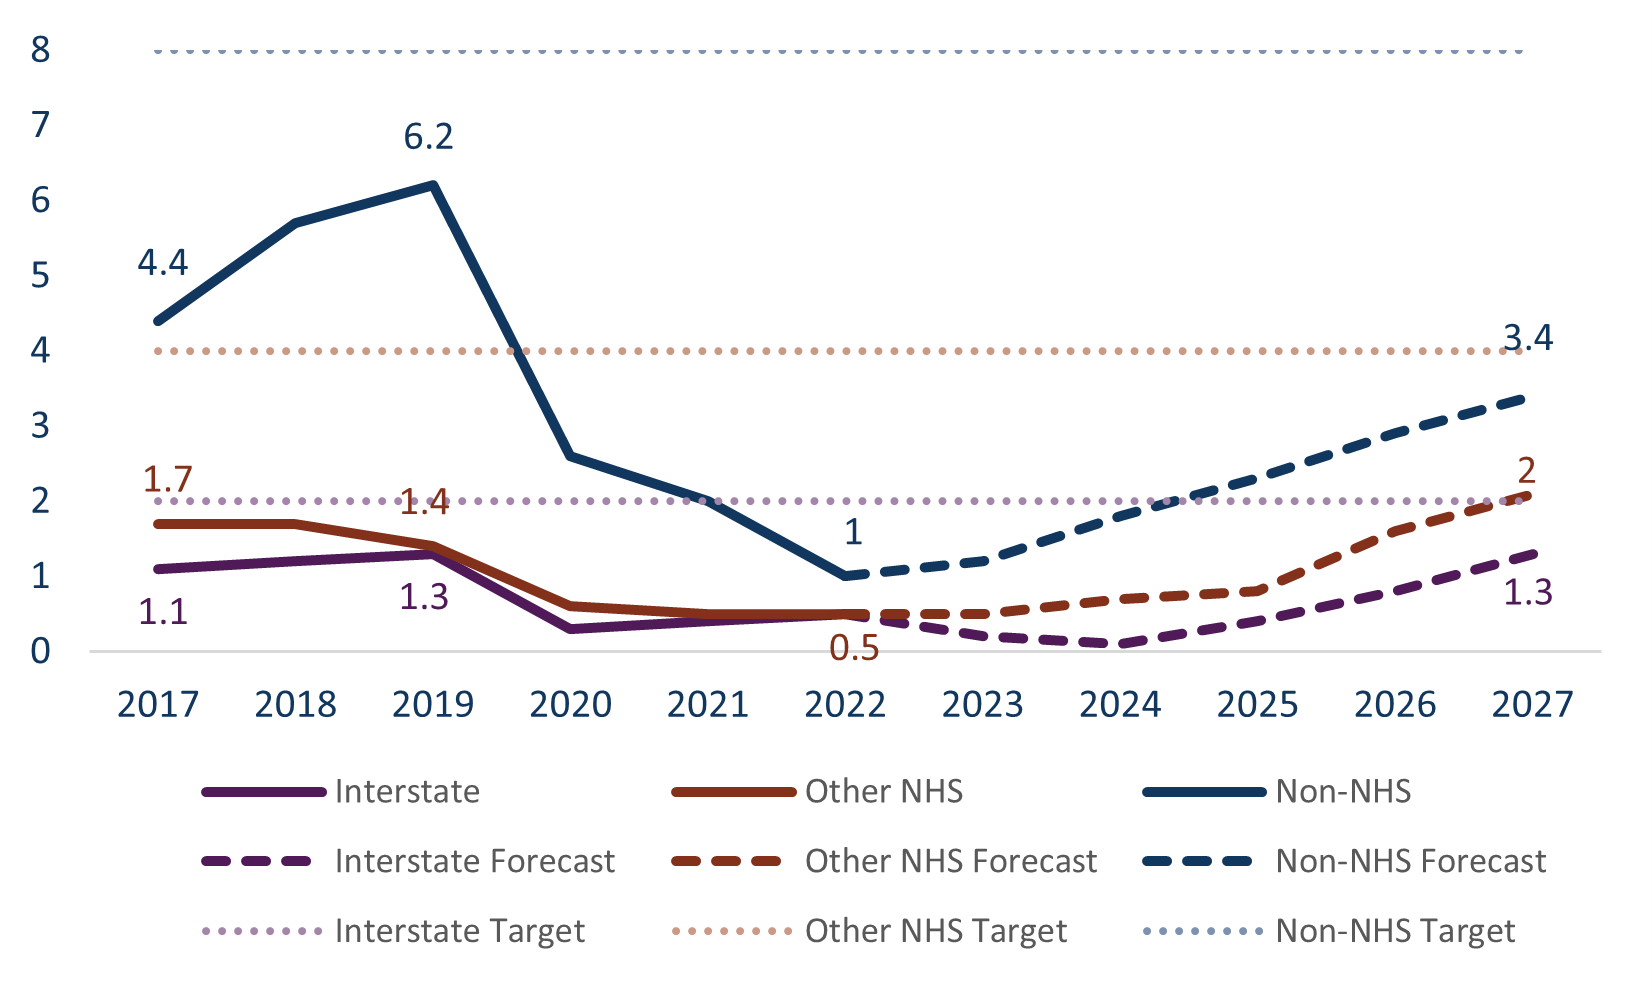
Figure 2-2: Statewide Average Remaining Service Life
Bridge Condition
MnDOT is committed to a regular schedule of condition assessment and preventive maintenance to keep state highway bridges in good condition. Approximately 43% of MnDOT owned highway bridges are more than 50 years old. Like state highway pavements, aging bridges require more costly repairs to be maintained in serviceable condition.
MnDOT measures its performance in Bridge Condition by reporting on the percent of deck area in poor condition through regular inspections. The condition measure includes ratings of the deck, the substructure and the superstructure for bridges on the state highway system. MnDOT set a goal that the share of NHS bridges in good structural condition should be 55% and those in poor structural condition should be 5% or less, measured by deck area. Bridges rated in poor condition are safe to drive on but are approaching the end of their service life. Structurally unsafe bridges are either closed or strengthened immediately.
MnDOT also must report on federal performance measures for NHS bridge condition. MnDOT is required to keep the percent of NHS bridges in poor condition below 10%. MnDOT’s own target is more stringent than the federal target. Keeping state highway bridges out of poor condition saves money and maintains a safe and accessible system.
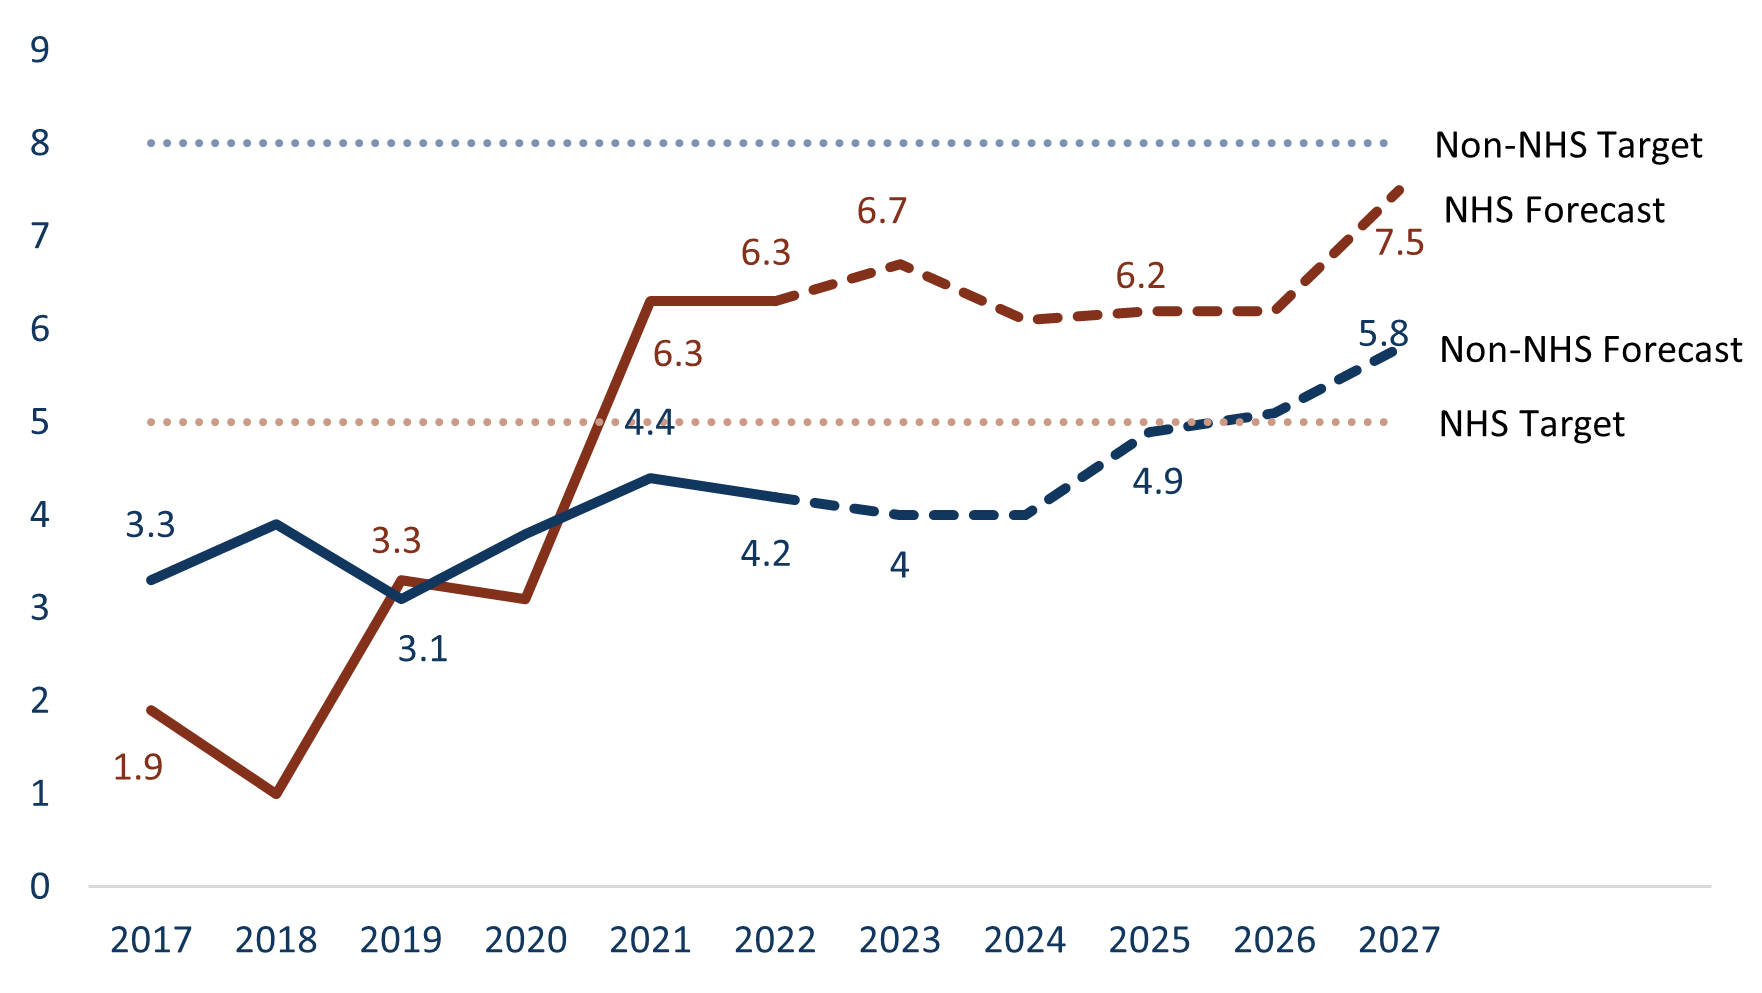
MnDOT is not currently meeting its target for NHS bridges in poor condition but is meeting targets for non-NHS bridges, as shown in Figure 2-3. As of 2022, the percent of NHS bridges in poor condition (6.3%) exceeded the target of 5% poor and has increased steadily since 2018.
Figure 2-3: Current and Forecast Percent of State Highway Bridges in Poor Condition
Roadside Infrastructure
In 2022, MnDOT completed its federally required Transportation Asset Management Plan (TAMP). The TAMP included condition information, investment strategies and projections for 12 state highway asset types. MnDOT has developed performance measures and targets for all the assets included in the TAMP. A selected list of these assets is shown in Figure 2-4. The work from the TAMP planning process has enhanced the planning for roadside assets and provides a better understanding of their needs and current conditions for MnSHIP.
Figure 2-4: Roadside Infrastructure Asset Condition
| Roadside Asset | Condition Year | Asset Condition |
|---|---|---|
| Culverts | 2020 | 17% poor |
| Lighting | 2021 | 12% beyond useful life |
| Noise Walls | 2021 | 6% poor |
| Overhead Sign Structures | 2021 | 14% poor |
| Traffic Signals | 2021 | 9% beyond useful life |
Currently, MnDOT is able to address some of its roadside infrastructure needs as part of other construction projects. However, MnDOT has not been able to fix most assets at optimal points in their life cycles under the current investment program. Roadside infrastructure conditions will likely deteriorate unless additional investments are made. Repairing and replacing these assets requires staff time and resources. Expanding the state highway system also increases the number of roadside assets to maintain.
Rest Area Condition
Rest areas is a new investment category in this plan. It includes all 52 MnDOT-owned rest areas. MnDOT measures rest area building condition through periodic assessments. In 2021, 6% of rest area buildings were in poor condition. Rest area buildings are aging and more facilities will fall into poor condition without additional investment.
MnDOT also began assessing parking lot pavement condition in terms of percent of parking lots in poor condition. There is no set condition target for parking lot pavement currently. An inventory is scheduled to be completed within the next four years to assess ADA compliance issues with rest area buildings, sites and parking lots to better understand where there are ADA compliance issues. Currently, ADA needs are identified as a part of individual rest area projects and any nearby pavement project scoping processes.
Climate Action: Conditions and Trends
Climate Resilience
MnDOT does not currently have performance measures related to Climate Resilience beyond asset condition measures. The 2022 Statewide Multimodal Transportation Plan identified a need to develop and refine measures of system and asset resilience. These are work plan items in the plan. System resilience is being further refined through the Resilience Improvement Plan that MnDOT is developing.
The department also produces an annual sustainability report which tracks greenhouse gas emissions from the transportation sector, electric vehicle adoption and native seeding and planting by MnDOT among other measures. Since 2016, transportation has been the largest contributor to greenhouse gas emissions in the state. Climate change impacts from high temperatures, large storms and more are impacting transportation. These impacts are anticipated to continue and intensify as Minnesota’s climate continues to warm.
Transportation Safety: Conditions and Trends
Transportation Safety
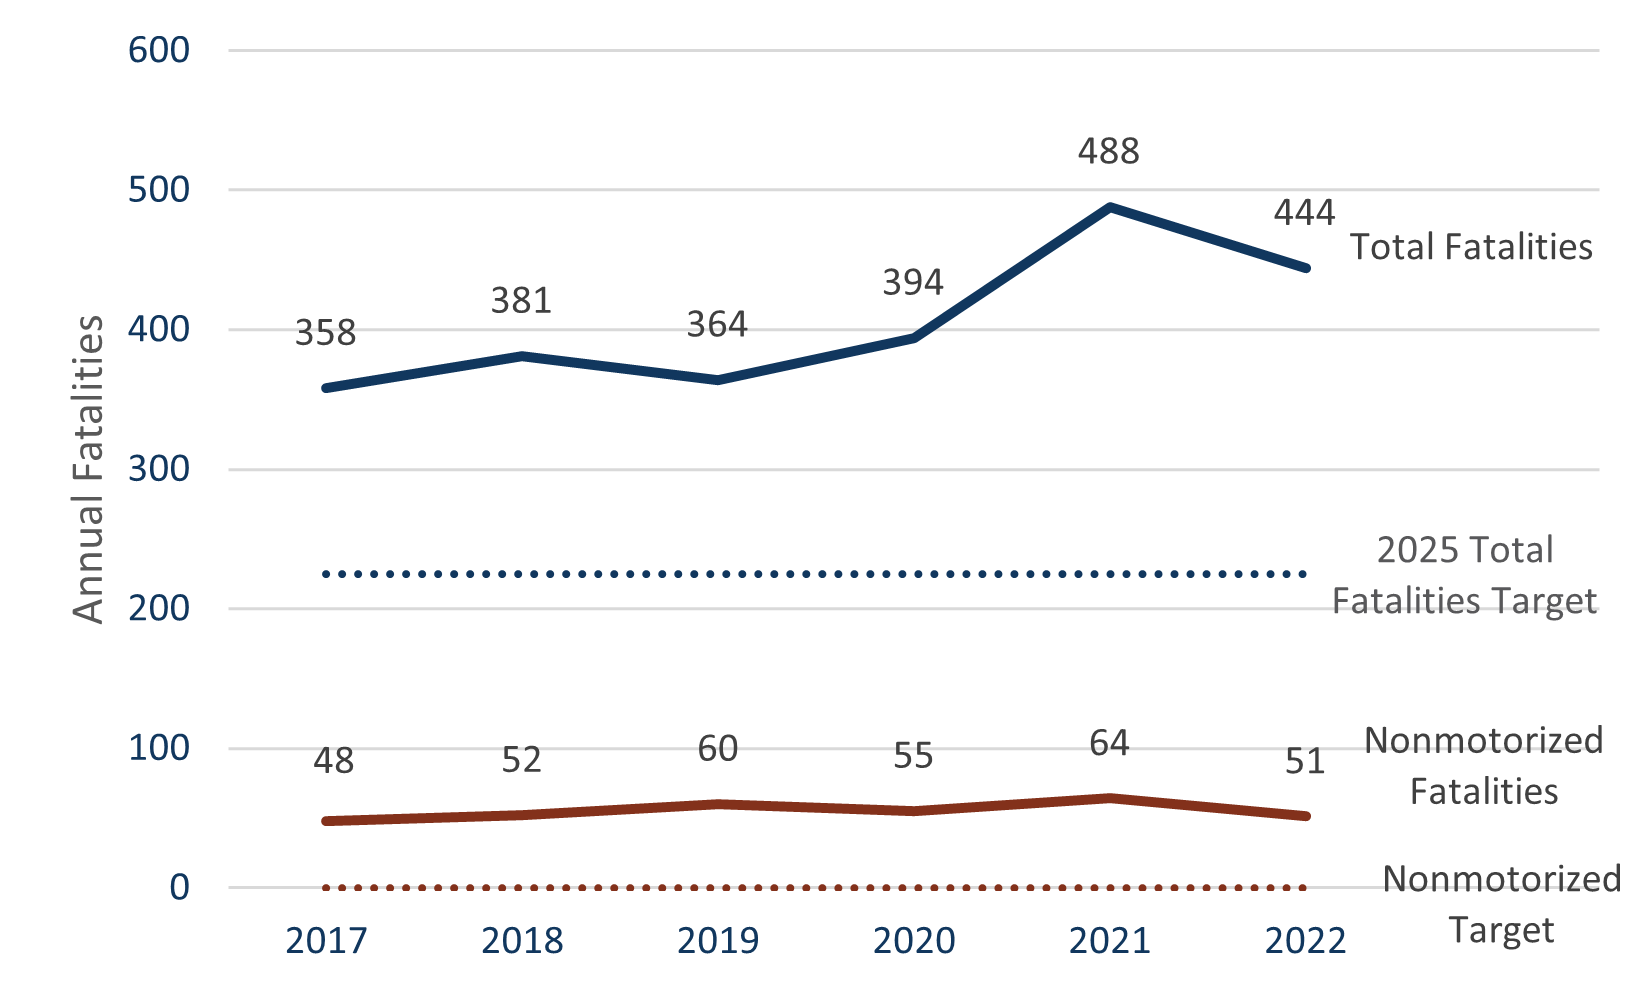
MnDOT measures transportation safety improvements in the number of projects implemented, and in the reduction of fatal and serious injury crashes across the entire roadway system. The Strategic Highway Safety Plan set targets to measure the state’s progress in Transportation Safety. MnDOT aims to help the state reach 225 or fewer fatalities and 980 or fewer serious injuries by 2025. The long-term goal in coordination with the Toward Zero Deaths (TZD) program is to eliminate fatalities and serious injuries on Minnesota roadways.
On an average day in 2022, at least one person died on Minnesota roadways (444 deaths total [see Figure 2-5]). This vehicle crash-related fatality total is above the statewide TZD goal of fewer than 225 deaths per year by 2025. With 1,913 serious injuries in 2022, Minnesota was well above the TZD target of 1,200 or fewer serious injuries. After a decade of minimal change in roadway fatalities and serious injuries, crashes spiked sharply in 2021 and 2022.
Figure 2-5: Traffic Fatalities on Minnesota Roads, 2017-2022
Advancing Technology
Transportation technology is rapidly changing how the state highway system is used, planned, designed, built and maintained. Technology like traffic condition monitoring, maps, on-board vehicle monitors and real-time transit information have improved the ability for people and goods to move around Minnesota. Increasingly, communications and technology need to be integrated into the system to ensure transportation can meet its goals.
MnDOT currently measures technology performance through the Statewide Intelligent Transportation System (ITS) Plan. The ITS Plan contains 12 performance measures spread over 6 categories - safety, mobility, fiscal responsibility and sustainability, operations and maintenance, asset management and consistency. ITS infrastructure condition is tracked in the Roadside Infrastructure category. Additionally, the Connected and Automated Vehicles office (CAV-X) is currently developing performance measures centered upon connected and automated vehicle technology implementation.
Critical Connections: Condition and Trends
Highway Mobility
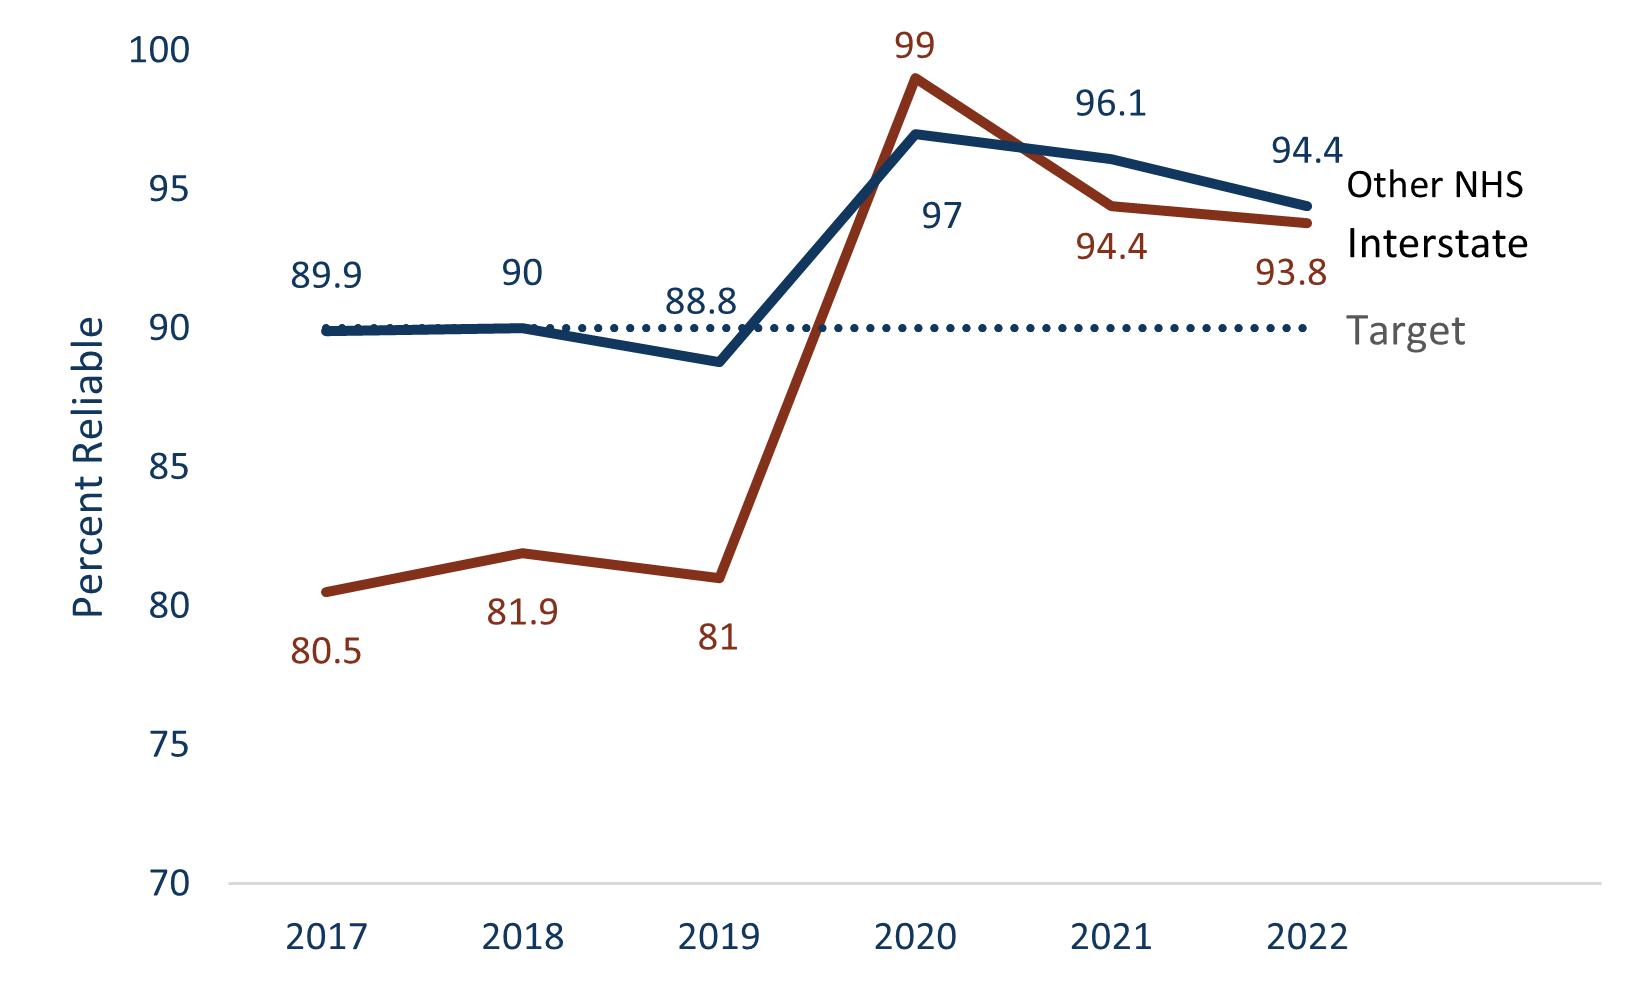
MnDOT tracks reliability on the NHS. Travel time reliability is important for the public and freight operators. For individual travelers, reliability may dictate what mode or travel route to use, or it may impact departure times. It is also a required federal measure. Figure 2-6 shows reliability on the Interstate and Other NHS since 2017. Due to the COVID-19 pandemic, reliability considerably improved in 2020 and has remained well above the target of 90% reliable.
Figure 2-6: Statewide Travel Time Reliability, 2017-2022
MnDOT recently adopted a measure of average delay per person in the Twin Cities Metro area. In 2018, there was 9.7 minutes of delay, slightly above the target of 9 minutes of delay. MnDOT is developing a methodology to track this measure moving forward.
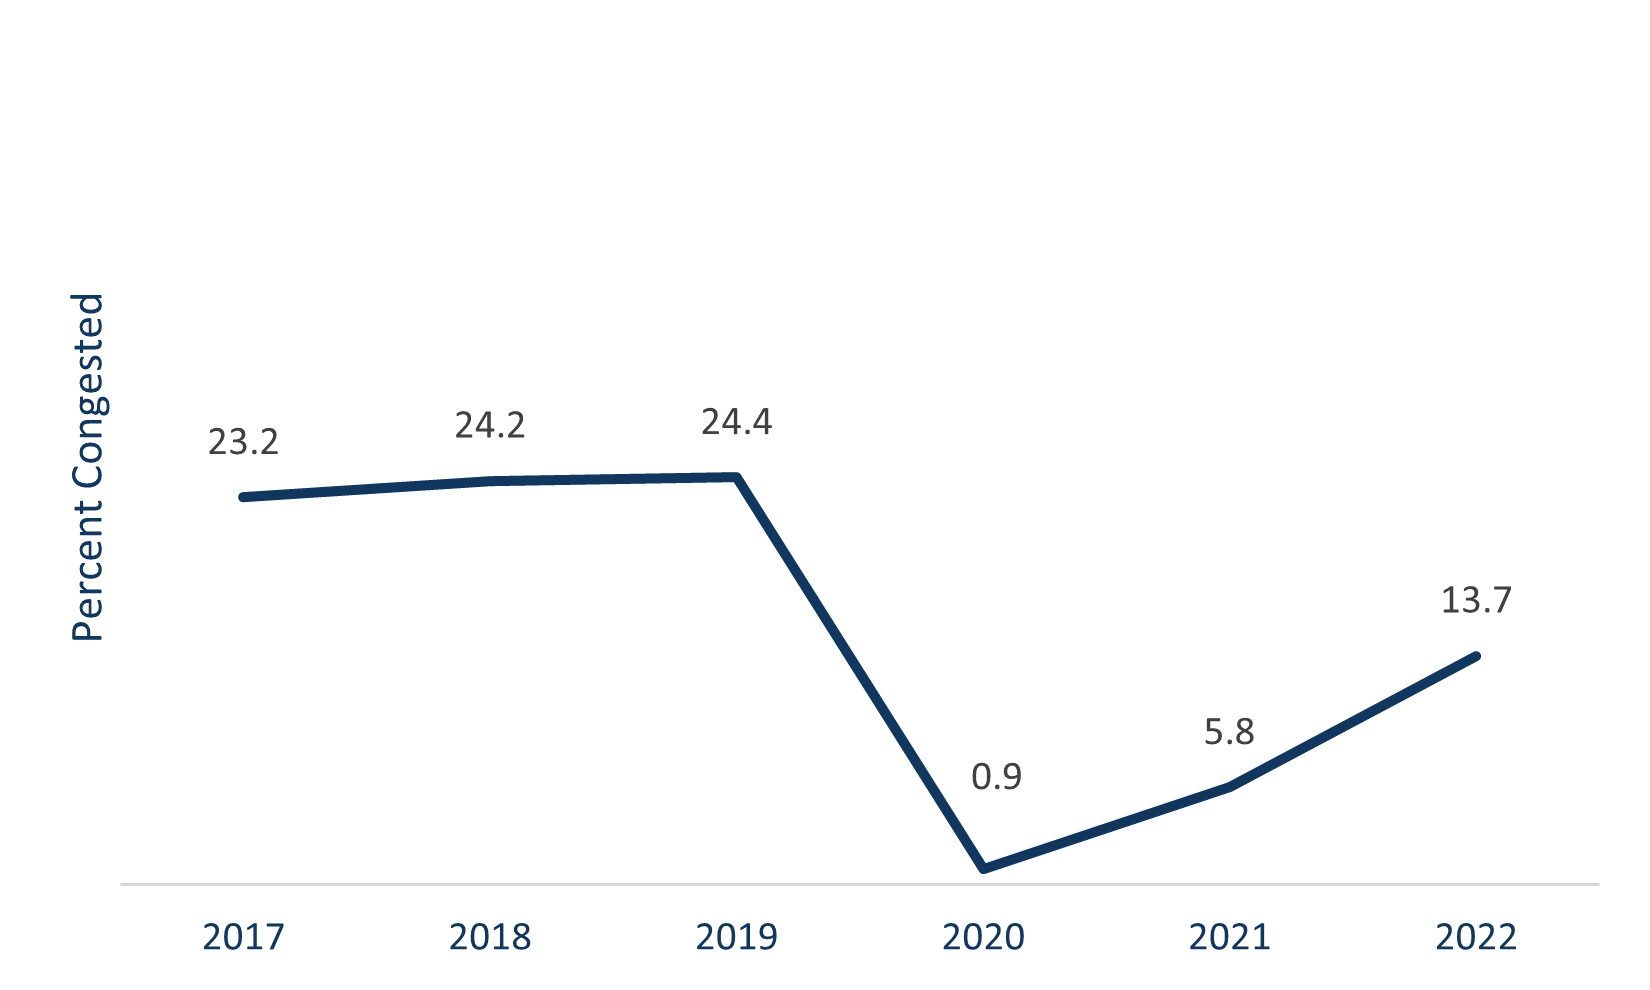
MnDOT also tracks congestion on Twin Cities NHS urban freeways by measuring the percentage of miles where vehicles are traveling below 45 miles per hour during morning or evening peak periods. The metro area freeway system had a marginal increase in the percentage of miles of freeway congested, from 24.2% in 2018 to 24.4% in 2019. The COVID-19 pandemic stay-at-home order decreased congestion by 30-50% initially and it remains at a 15-20% decrease. In 2020, only 1.4% of freeway miles were operating below 45 miles per hour during peak periods. Since 2020, congestion has increased to 13.7% of freeway miles operating below 45 miles per hour in peak periods.
Figure 2-7: Urban Freeway Miles Congested in the Twin Cities, 2017-2022
Freight
Freight includes the movement of all goods that travel in Minnesota across all modes. This includes trucks and other heavy commercial vehicles, rails, water ports, pipelines and air transport. Truck-only trips remain the primary means of shipping goods by value, but the share moved by other modes is increasing.
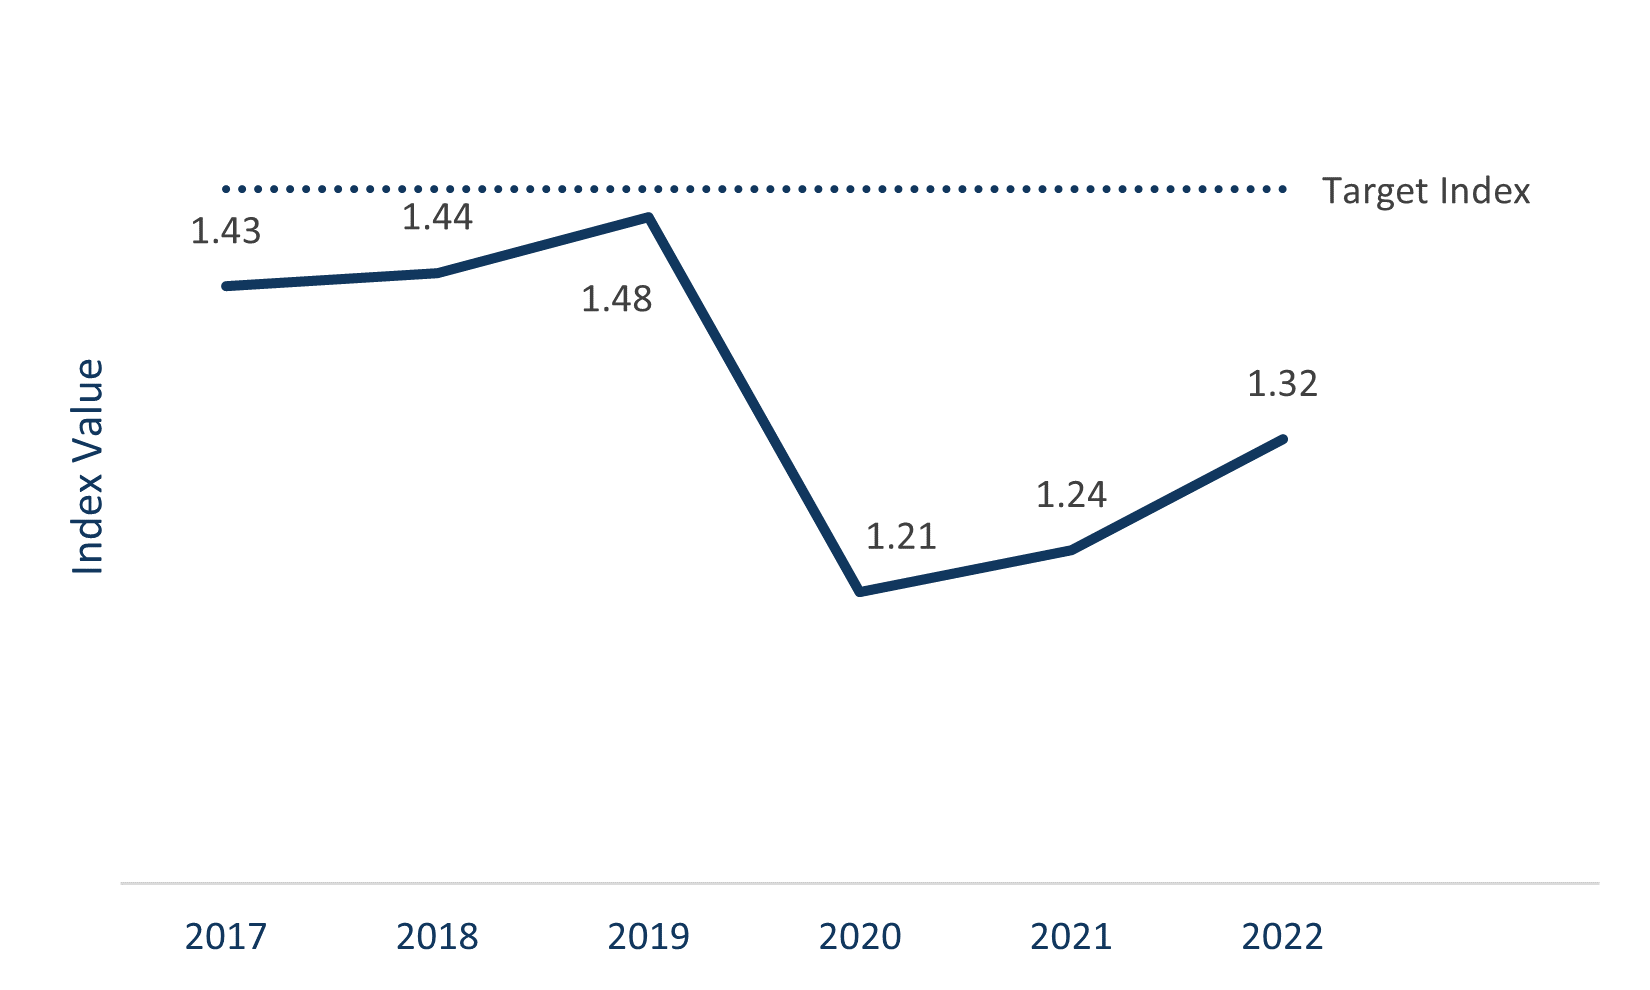
Truck Travel Time Reliability Index (TTTRI) is a performance measure that MnDOT monitors and is a required federal performance measure. TTTRI measures the variation in commercial truck travel times on the Interstate system. An index value of 1 is the lowest possible score and indicates the highest level of travel reliability. MnDOT’s target is 1.5. In 2022, the most recent data available, Minnesota’s TTTRI was 1.32. The COVID-19 pandemic caused fewer people to be on the road and resulted in lower TTTRI for 2020 and 2021 before picking up in 2022. However, the 2022 TTRI is still below pre-pandemic levels.
Figure 2-8: Statewide Truck Travel Time Reliability, 2017-2022
Pedestrian and Bicycle
Minnesota’s statewide walking, rolling and bicycling trends can be seen in the results of MnDOT’s Omnibus Survey, where respondents are asked which transportation modes they used over the past year. MnDOT’s Omnibus Survey is a biennial public opinion survey that provides department leadership, managers and program staff with public feedback on MnDOT’s core operations. The 2017 Omnibus Survey indicated 28% of respondents either walked or used a wheelchair or mobility device at least a few times per week, while 9% said they bicycle at least a few times per week. In 2019, 31% of respondents indicated they either walked or used a wheelchair or mobility device at least a few times per week, while 8% said they bicycle at least a few times per week. During 2020, COVID-19 had a substantial impact on the frequency of bicycling and walking statewide. Twenty percent of survey respondents indicated they walked or used a wheelchair more due to COVID-19 and 13% of survey respondents indicated they bicycled more due to COVID-19.
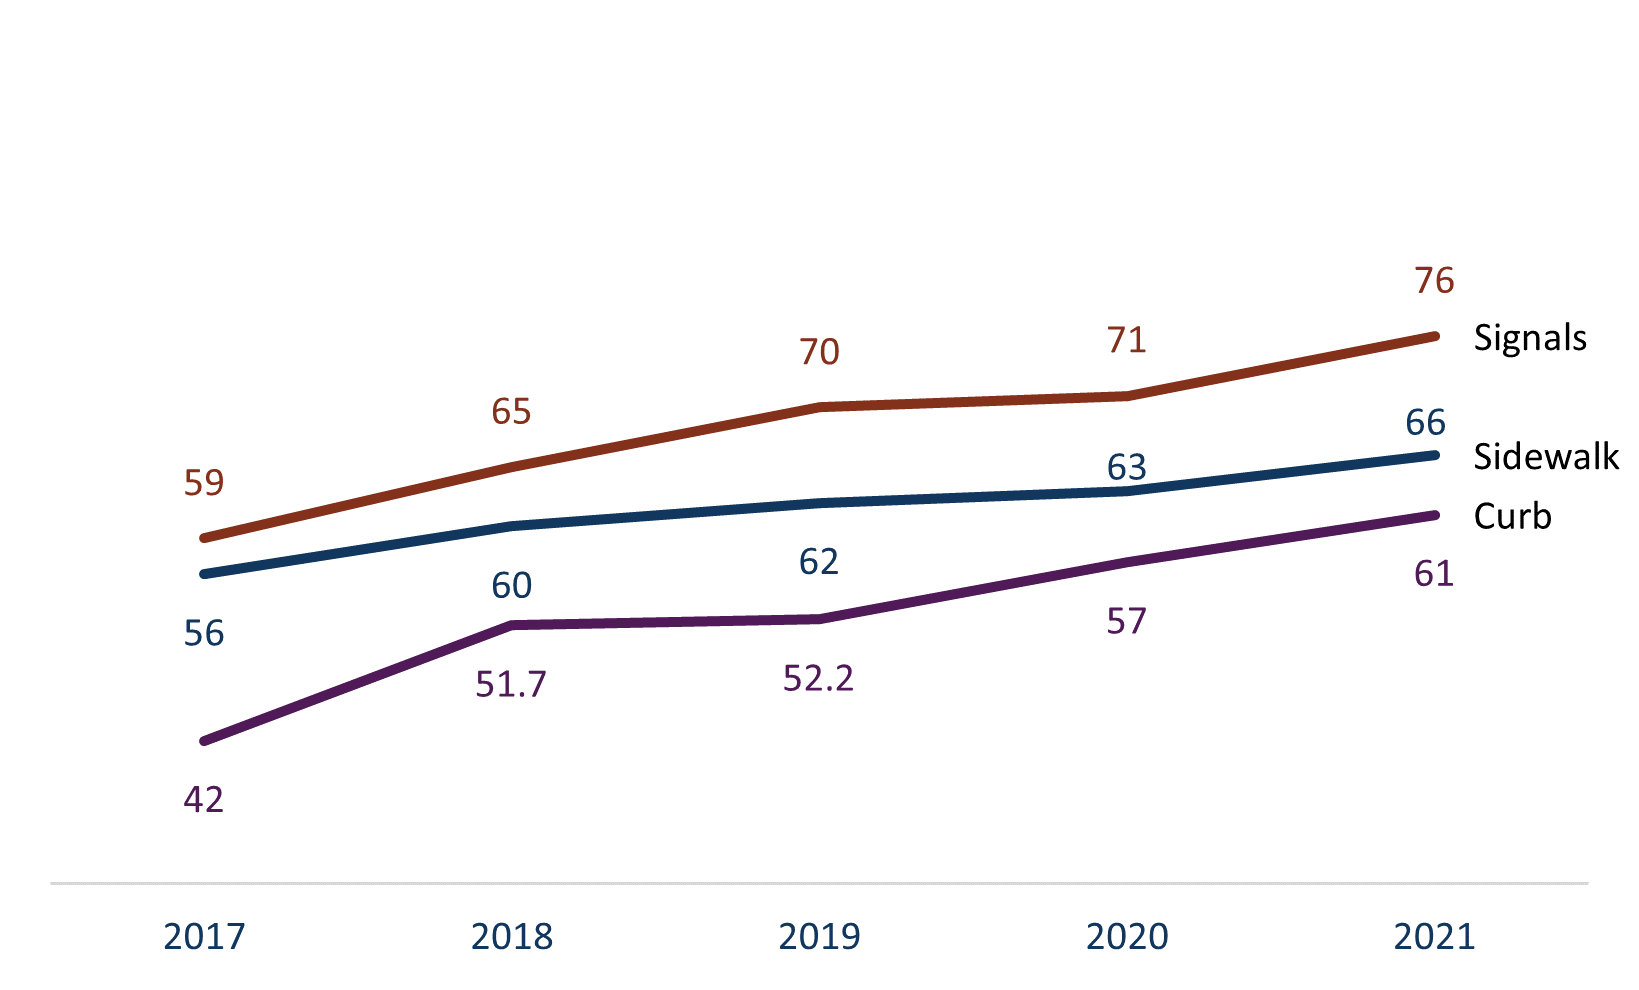
MnDOT also measures the condition of curb ramps and sidewalk (miles) and tracks the percentage that is compliant with ADA standards. ADA compliance is a federal standard that ensures accessibility for people with disabilities. Figure 2-9 shows the percent compliance of pedestrian infrastructure on state highways. Since 2017, MnDOT has made great progress on ADA compliance. Each pedestrian infrastructure asset is at least 60% compliant statewide. MnDOT is on track to meet its goal of being substantially compliant with ADA by 2037.
Figure 2-9: Percent Substantially Compliant, 2017-2021
Healthy Equitable Communities: Conditions and Trends
Local Partnerships
MnDOT does not have adopted performance measures for Local Partnerships but tracks investments in this category in several ways. For jurisdictional transfers, MnDOT tracks the miles of roadway transferred to other jurisdictions. For Transportation Economic Development, MnDOT counts the number of projects funded, jobs supported through transportation investment and leveraged local and private funds. For the Local Partnership Program, MnDOT tracks the number of projects partnered on and leveraged funds. For landscape partnerships and municipal agreements, MnDOT tracks the miles of roadway with green infrastructure improvements.
Partnering with local communities has increased in importance as local partners have received competitive grants for projects on the state highway system. MnDOT will continue to identify how many projects and how much investment is led by our local partners.
Main Streets/Urban Pavements
Main Streets/Urban Pavements is a new investment category in MnSHIP. Currently, there is not a performance measure for this category, but these investments support the pavement condition targets. Investment in Main Streets/Urban Pavements also helps achieve goals for ADA compliance, pedestrian and bicycle system completion and partnering with local communities.
Other: Conditions and Trends
Project Delivery
Project Delivery is critical to ensuring timely and efficient delivery on all projects constructed on the state highway system. While performance is not measured for this category, MnDOT tracks how much it has spent on Project Delivery investments as part of its overall investment program.
Historically, Project Delivery has accounted for approximately 20% of MnDOT’s annual capital investment program. However, the Project Delivery percentage changes year-to-year based on the mix of investments it supports. For example, when MnDOT delivers a program that includes a number of expansion projects, it invests more on Project Delivery due to the increased need for right of way purchases and design of more complex projects. When the majority of MnDOT’s program consists of asset preservation projects in settings that are less complex such as rural areas, a smaller percentage of its overall program goes toward Project Delivery. MnDOT strives to reduce the overall need for Project Delivery through innovative design, early project identification and shared services.
- Remaining service life is the number of years until the pavement is required to have a major fix.