
Chapter 6
Investment Direction
The investment direction presented in this chapter is focused on four main themes over the next 20 years. They are:
- Maintain the existing system
- Improve mobility, accessibility and safety for all
- Begin to adapt to a changing future
- Focus on communities and livability
The direction will guide investments so that transportation projects align with statewide goals as much as possible with available funding. This investment direction reflects federal funding from the Infrastructure Investment and Jobs act as well as increases to state funding passed in the 2023 legislative session.
MnDOT districts select and develop projects that are consistent with the investment direction in MnSHIP.
Project Selection
While MnSHIP sets MnDOT’s investment priorities for a 20-year time period, MnDOT does not identify specific projects over the 20 years. MnDOT identifies potential projects in the first 10 years of the plan through the 10-Year Capital Highway Investment Plan (CHIP). The CHIP translates the 20-year investment direction into planned and programmed projects that collectively achieve the outcomes identified in MnSHIP. The CHIP consists of two time periods. Projects in Years 1-4 are a part of the State Transportation Improvement Program (STIP). Projects are programmed and scheduled in the STIP. MnDOT is committed to delivering these projects over the next four years. Projects in Years 5-10 are not yet committed. They are in the budget, but project timing, scope and cost may change. Together, projects in Years 1-10 comprise the 10-Year CHIP. The following sections explain how the investment direction will influence project selection in each year of the 20-year plan.
Project Selection Policy
In 2017, the Minnesota Legislature directed MnDOT to develop and implement a new transparent and objective project selection policy for construction projects on the state highway system. The project selection policy was first implemented with the 2020-2023 State Transportation Improvement Program and 2020-2029 Capital Highway Investment Plan.
The policy requires that MnDOT use scores to prioritize and select highway construction projects. The scores inform project selection decisions, but MnDOT may consider other factors in addition to the score. MnDOT selects projects within various categories and programs. Each category and program has a separate process to evaluate, prioritize and select projects.
Broadly, these categories and programs include:
- Asset management: the rehabilitation and replacement of pavement, bridges and other infrastructure.
- Targeted safety improvements: enhancements to reduce the number of crashes and people injured or killed on Minnesota state highways.
- Mobility and capacity expansion: improvements to traffic flow, congestion relief and travel time reliability, freight movement, or creating new connections for active transportation users such as people walking and bicycling.
Each broad category has sub-categories within which projects are evaluated and selected. For example, pavement projects are scored and prioritized separately from bridge projects. MnDOT also manages a variety of special programs with specific objectives, which typically do not fund asset management projects. MnDOT posts all candidate projects, scoring methodologies and project selection reasoning at MnDOT’s project selection website.
Once a project is selected, MnDOT develops and evaluates alternatives to address the identified need and other legal requirements, opportunities to advance legislative goals, objectives in state plans, and other repairs and improvements that make sense to do at the same time. The department follows a complete streets approach, which considers the needs of all the different types of vehicles and people who will use the road or bridge. MnDOT balances the identified needs and opportunities against the funding guidance of MnSHIP and looks for cost-effective and affordable solutions. MnDOT also works with local and regional partners, metropolitan planning organizations, tribal governments and regulatory agencies, and seeks public input during the project’s development.
Influence Of Investment Direction on Project Selection in Years 1-4
For the STIP years (2023-2027) of MnSHIP, MnDOT has already committed to projects based on the investment direction in the 2017 MnSHIP. MnDOT has spent funding to scope and develop these projects using that investment guidance. MnDOT tries to avoid any changes to projects in the STIP, if possible. Therefore, this investment direction does not change projects in years 2023 to 2027.
Influence Of Investment Direction on Project Selection in Years 5-10
The draft MnSHIP investment direction guided project selection from 2028 through 2033 for the 2024-2033 CHIP. MnDOT developed this CHIP before the MnSHIP investment direction was finalized. The final MnSHIP investment direction described below will be reflected in the 2025-2034 CHIP. The current projects listed in the 10-Year CHIP will be updated to reflect the MnSHIP investment direction and MnDOT will work to try to limit the changes to these projects. New projects will need to be identified to ensure that selected projects follow the investment direction in this plan.
Influence Of Investment Direction on Project Selection in Years 11-20
MnDOT does not identify individual projects beyond 10 years in MnSHIP. Investment in those years is identified by investment category only. However, the CHIP is updated annually so new projects are added to year 10 with each version of the CHIP. These new projects will follow the investment direction established in this document. Additional information on project selection and investment programs can be found in Appendix C: Financial Summary.
Investment Summary
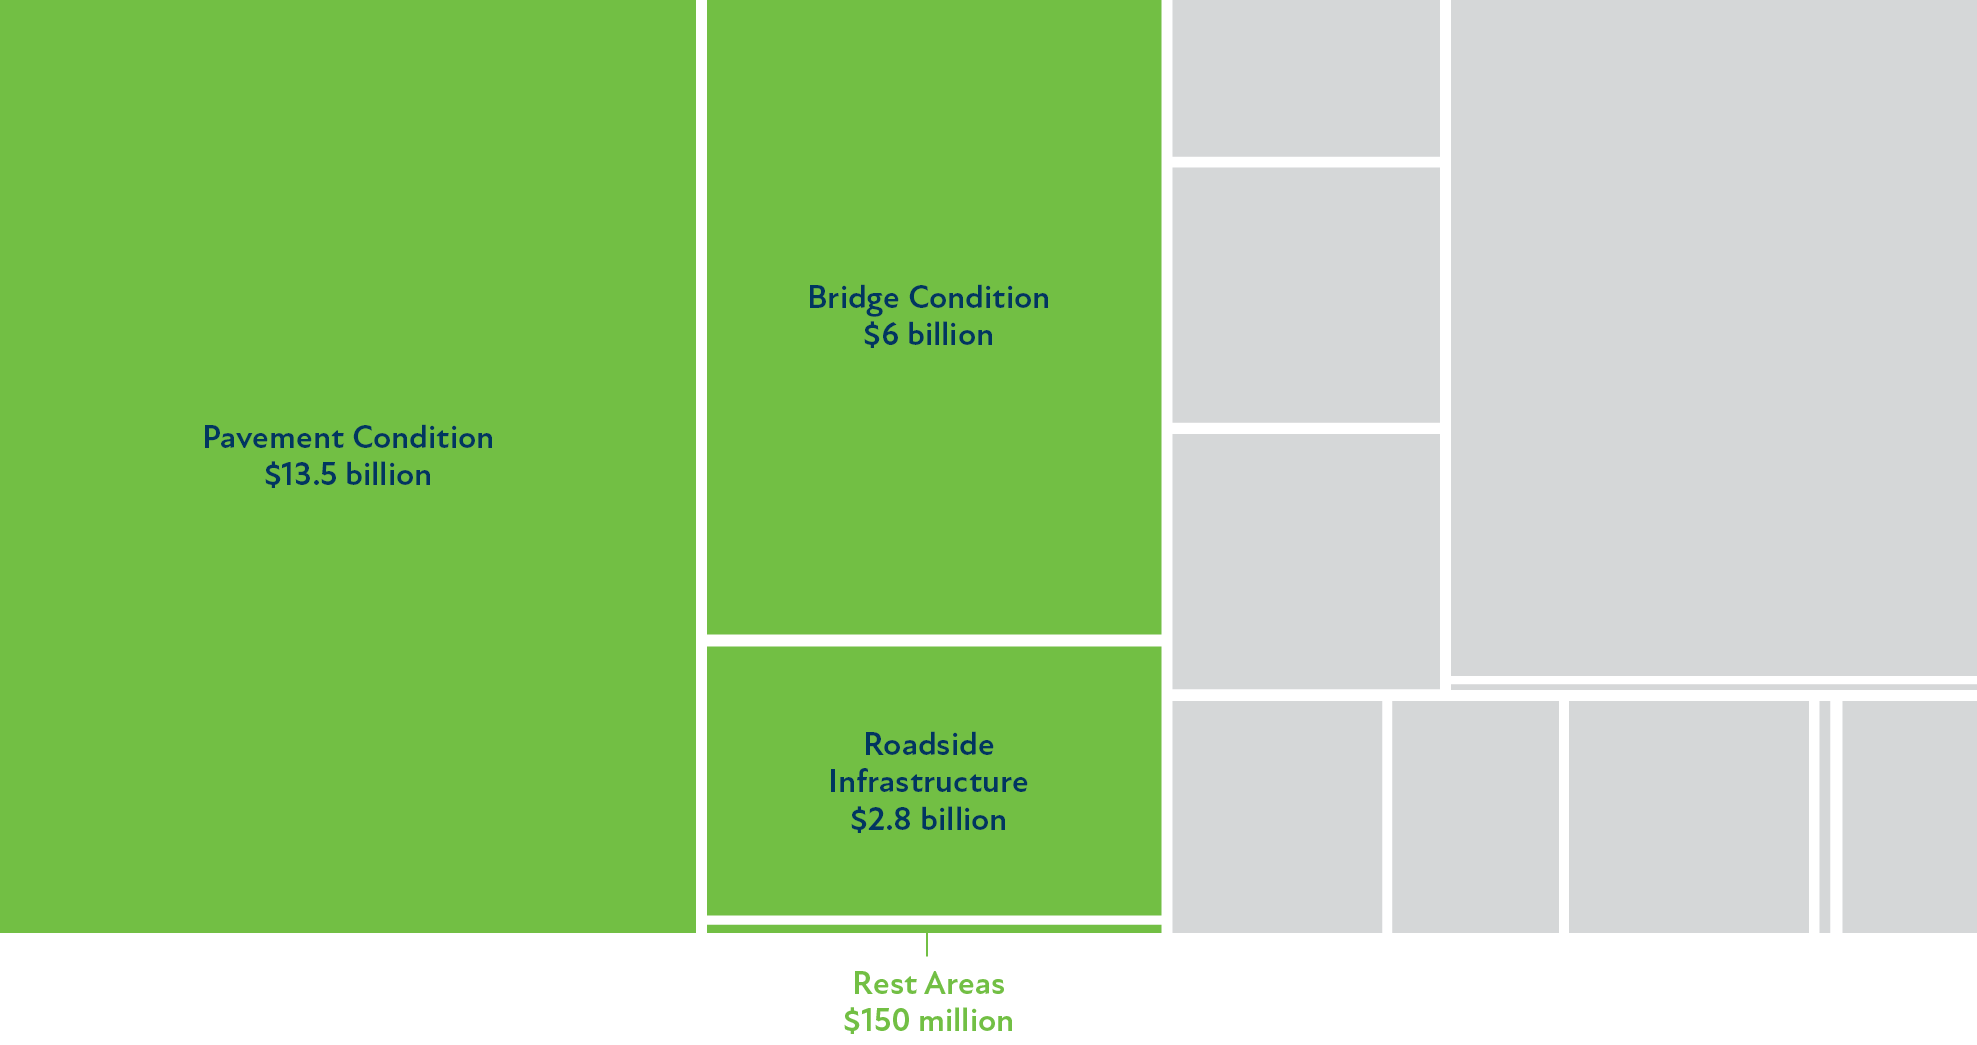
The 20-year investment direction focuses on maintaining the existing state highway system, improving mobility, accessibility and safety for all, beginning to adapt to a changing future and improvements for communities and livability. This approach reflects both public and stakeholder input and meets key requirements and agency commitments. The investment direction does not affect the projects already developed and programmed in Years 2023 through 2027. The priorities identified in this plan will be reflected in investments and projects starting in 2028. Figure 6-1 shows the distribution of expenditures through all years of the plan.
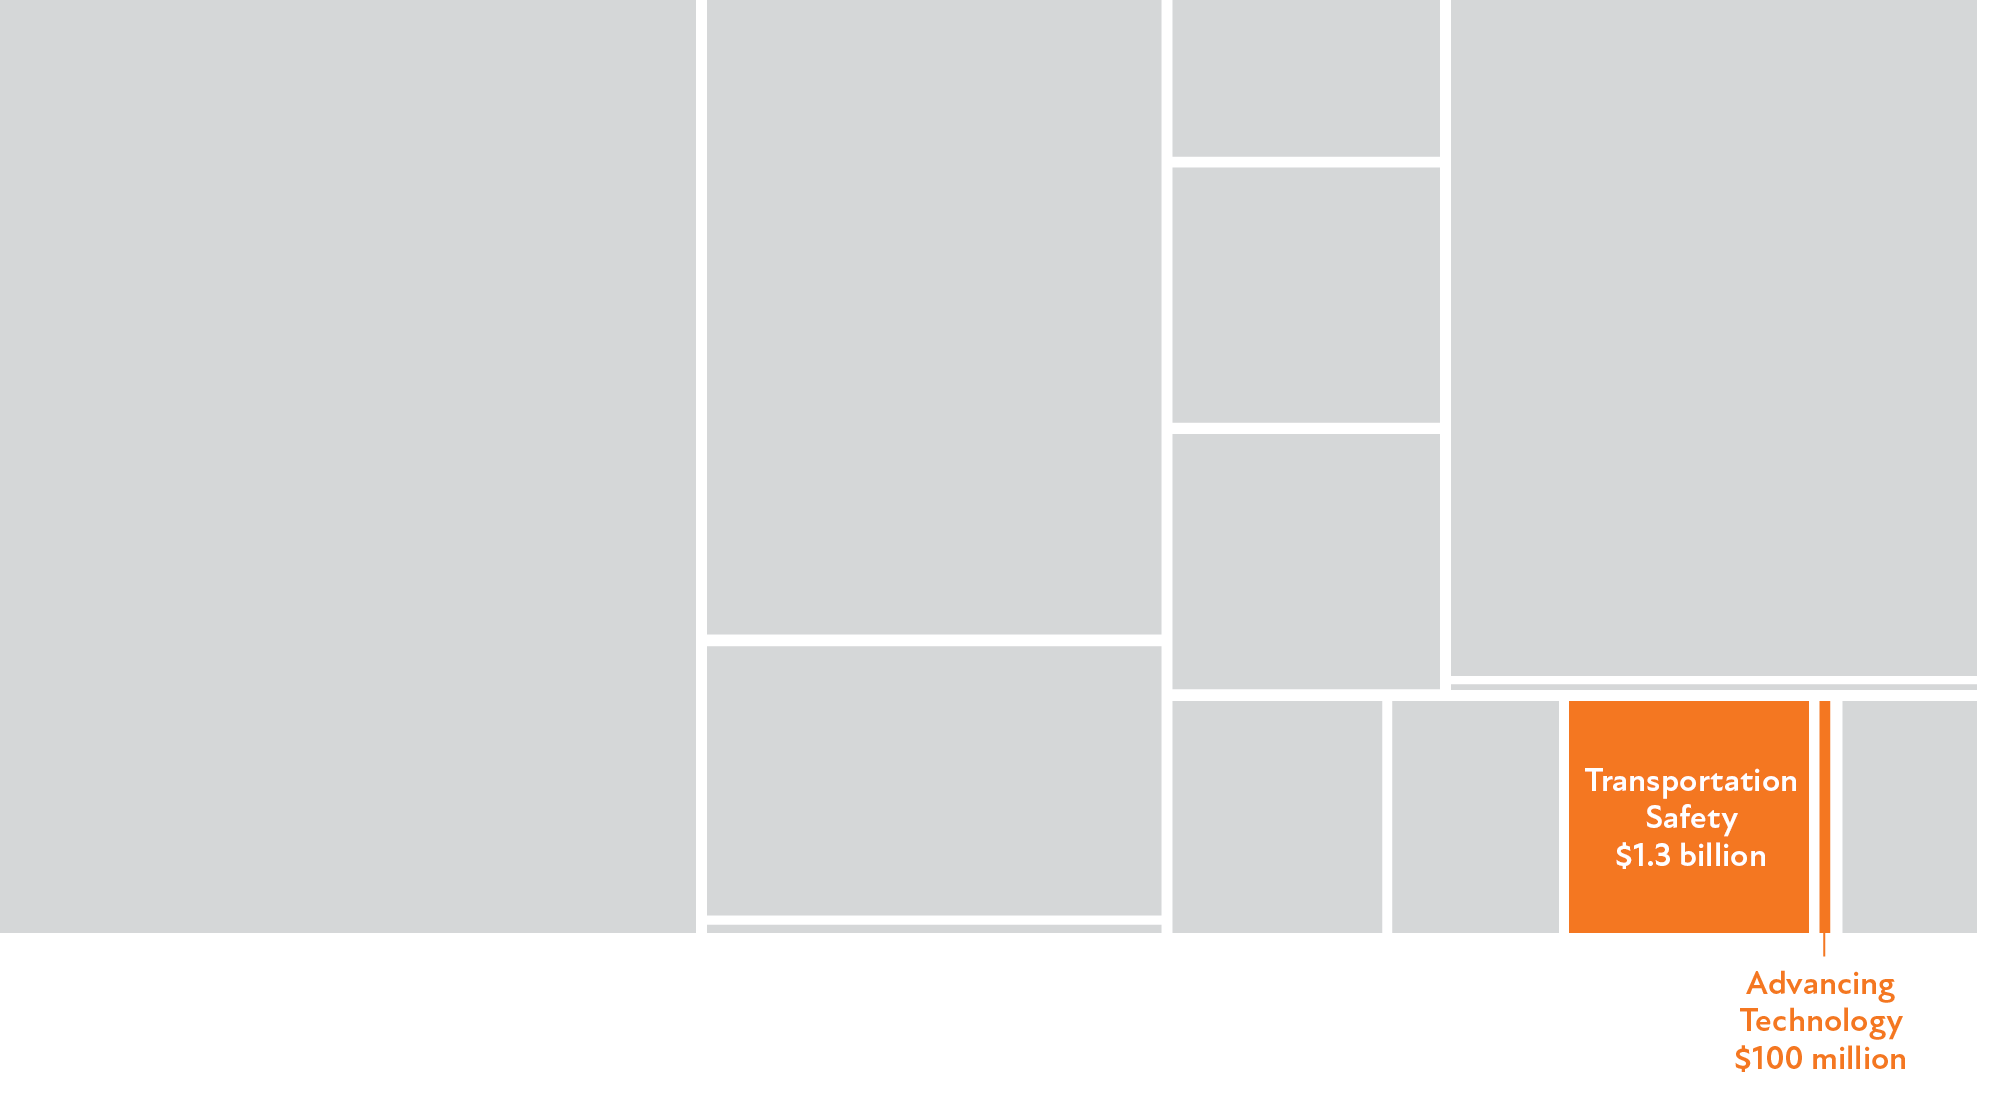
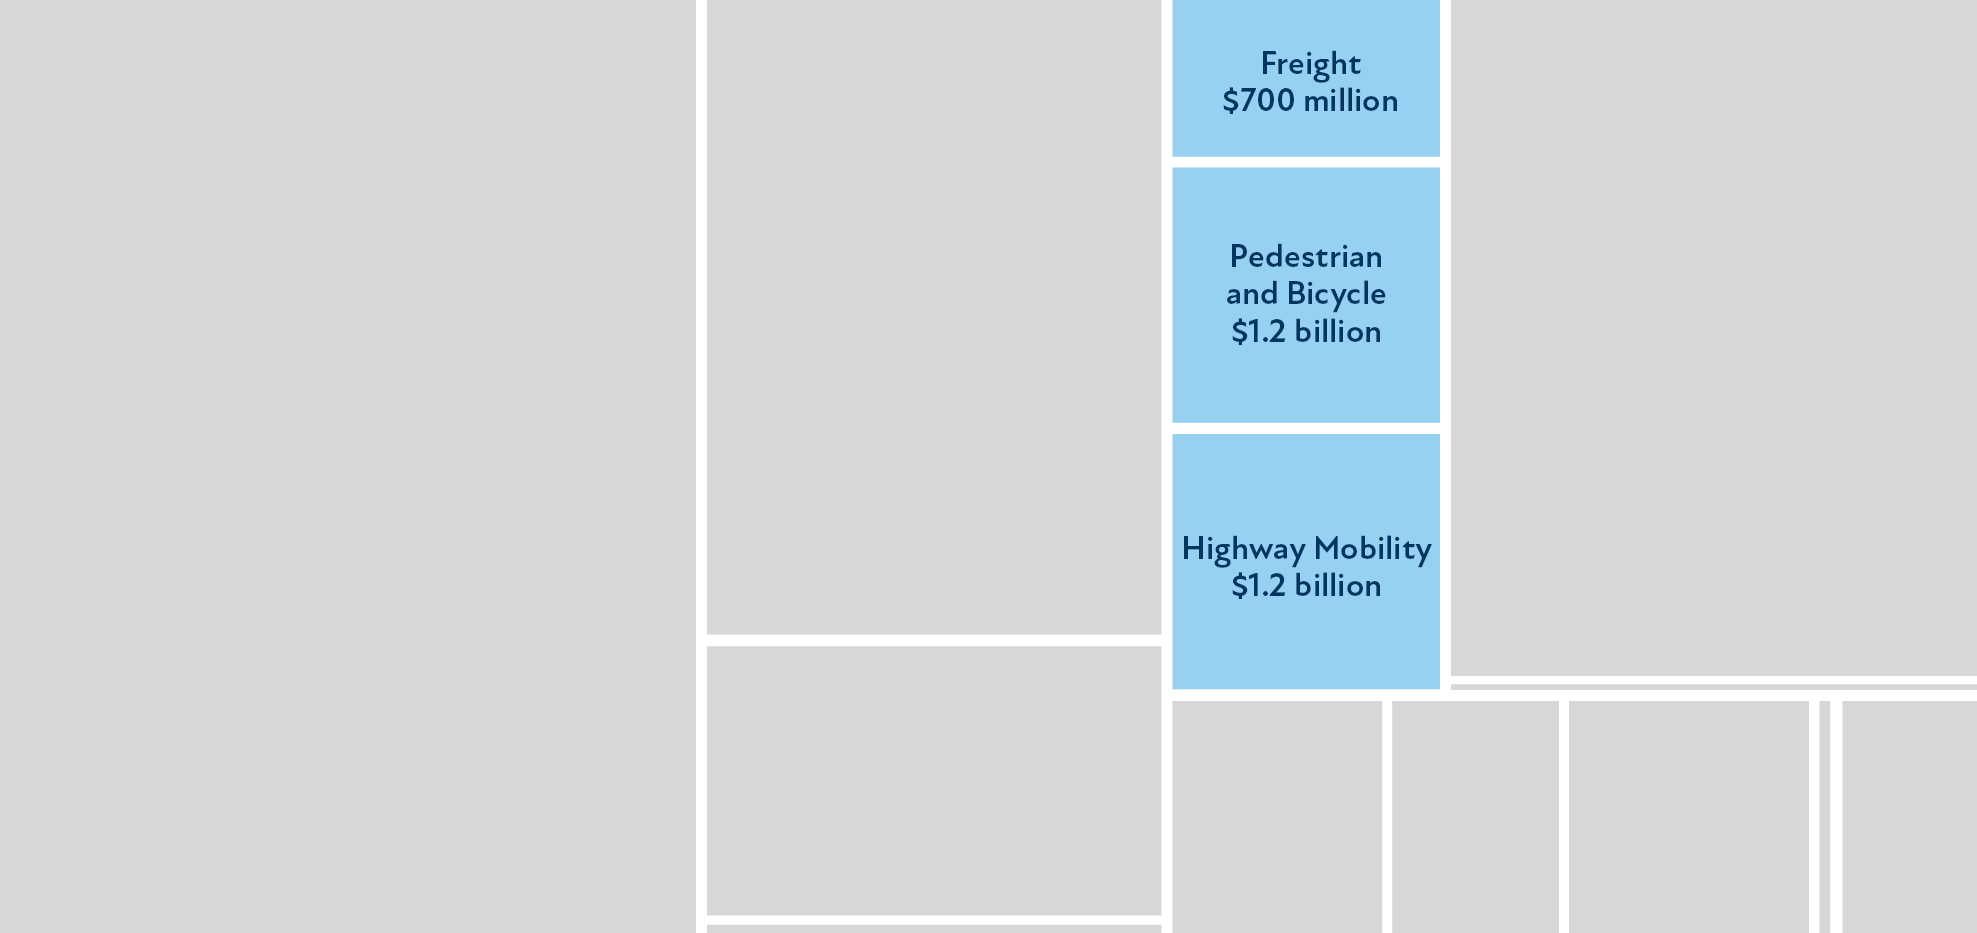
Figure 6-1: 20-Year Capital Highway Investment Direction
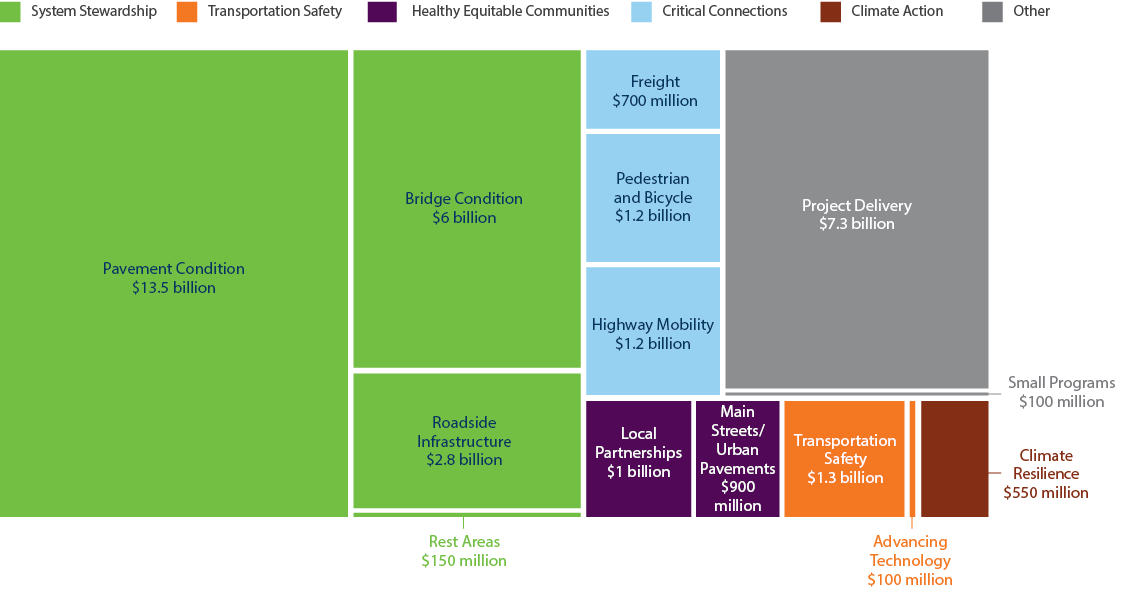
Figure 6-2 on the following page summarizes the total amount of investment for MnSHIP. It also includes current conditions and associated outcomes for each of the 14 investment categories.
Figure 6-2: Total Investments, Outcomes and Current Condition
| Investment Category | Objective Area | Current Conditions (2022) | Projected Outcome(s) in 2042 | Total Investment (2023-2042) |
|---|---|---|---|---|
| Pavement Condition | System Stewardship | Meet MnDOT targets for all pavement systems.
| NHS and Non-NHS pavement condition worsen. Interstate condition meets MnDOT targets and federal minimum threshold.
| $13.5 billion |
| Bridge Condition | System Stewardship | NHS bridge condition slightly exceeds MnDOT’s target. Non-NHS meets MnDOT targets for bridge condition.
| Non-NHS bridge conditions worsen, while NHS bridge condition is maintained. Federal minimum threshold for NHS bridge condition is met.
| $6.0 billion |
| Roadside Infrastructure | System Stewardship | Roadside infrastructure condition is not meeting targets (2020 and 2021 data).
| The condition of all roadside infrastructure assets will deteriorate. Condition will not be met. Maintenance can delay assets dropping into poor condition.
| $2.8 billion |
| Rest Areas | System Stewardship | 6% of rest areas are in poor condition. | 16% of rest areas will be in poor condition. Rest area buildings will be ADA compliant. | $150 million |
| Climate Resilience | Climate Action | 50% of projects planted with native plantings. 61% of projects seeded with native seeding. | Address highest risk flooding and snow trap locations. Increase green assets on state highways. | $550 million |
| Transportation Safety | Transportation Safety | Roadway fatalities and serious injuries have spiked since 2020. 446 fatalities and over 1,900 serious injuries in 2022. | Increased investment to address locations with high crash rates and non-motorized safety issues. | $1.3 billion |
| Advancing Technology | Transportation Safety | No identified performance measures. | Expand ITS to 200-250 miles of state highways and address immediate and medium needs for fiber network expansion. | $100 million |
| Highway Mobility | Critical Connections | Interstate and Other NHS over 93% reliable. 9.7 minutes of delay per person in the Twin Cities (2018). | Traveler delay to increase to 11-12 minutes per person in the Twin Cities. Reliability likely to remain stable in Greater Minnesota. | $1.2 billion |
| Freight | Critical Connections | Truck Travel Time Reliability is meeting federal targets. | MnDOT does not forecast TTRI. MnDOT will address highest priority freight improvement locations and expand truck parking. | $700 million |
| Pedestrian and Bicycle | Critical Connections | Progress is being made towards ADA compliant pedestrian infrastructure.
| Pedestrian infrastructure will be substantially compliant with ADA by 2037. | $1.2 billion |
| Local Partnerships | Healthy Equitable Communities | No identified performance measure. | MnDOT will be able to respond to local priorities through the Local Partnership Program, TED and partnering on locally-led projects. Livable communities program funded. | $1 billion |
| Main Streets/Urban Pavements | Healthy Equitable Communities | No identified performance measure. | 125-145 candidate locations addressed. | $900 million |
| Project Delivery | Other | Invest the amount necessary to deliver projects in the other categories. | Invest the amount necessary to deliver projects in the other categories. | $7.3 billion |
| Small Programs | Other | No identified performance measures. | Continue to invest in small programs such as off-system bridges and historic properties. | $100 million |
| Total | $36.7 billion |
Investment Direction Themes
Maintain the Existing System
MnDOT continues to invest the majority of capital funds to maintain existing state highway infrastructure including pavements, bridges and roadside infrastructure. With additional state and federal funding, MnDOT is able to meet performance targets for Interstate pavement as well as NHS and non-NHS bridge condition.
Improve Mobility, Accessibility and Safety for All
The MnSHIP investment direction increases funding to improve mobility for all users of the state highway system. This includes motorists, freight haulers, transit users, pedestrians and bicyclists. In particular, the investment direction includes increased funding for pedestrian infrastructure to achieve compliance with the Americans with Disabilities Act and help implement the Statewide Pedestrian System Plan and District Bicycle Plans. Safety funding is increased to improve safety at locations with high crash rates and to address safety for vulnerable road users.
Begin to adapt to a changing future
Minnesota’s climate is changing and will continue to do so for the foreseeable future. This plan includes a new Climate Resilience investment category under the Climate Action objective area to advance a sustainable and resilient transportation system.
New technology is also transforming the way the transportation system is used. The MnSHIP investment direction includes funding to ensure state highways are best equipped for Connected and Automated Vehicles and enhanced Intelligent Transportation Systems to meet emerging technology needs.
Focus on communities and livability
Transportation can be a barrier, especially for underserved communities such as Black, Indigenous, and people of color, people with disabilities, people with low incomes and others. This plan funds a livable communities pilot program to improve connectivity across state highways. These include enhanced crossings, small freeway cap projects and under-bridge improvements.
Many state highways serve as a major commercial corridor in cities and towns throughout the state. Cities, counties and communities have many needs on these corridors. The MnSHIP investment direction includes a substantial increase in funding for urban pavement projects to address community priorities and deliver a more holistic and multimodal project. There are other enhanced funding areas for local partnerships including the Local Partnership Program. The investment direction also maintains existing funding to support economic development through the Transportation Economic Development program.
System Stewardship
The MnSHIP investment direction aligns with the System Stewardship objective and strategies in the Statewide Multimodal Transportation Plan. This objective is to strategically build, maintain, operate and adapt the transportation system based on data, performance and community needs.
Throughout the 20-year plan, MnDOT will prioritize infrastructure improvements on NHS routes and hold these roads to a higher performance standard than non-NHS routes. This approach allows MnDOT to comply with federal law and manage risks related to statewide travel.
While MnSHIP’s emphasis is on maintaining the existing system, MnDOT strives to achieve multiple objectives through coordinated investments. For example, drainage infrastructure (Roadside Infrastructure) helps pavements last longer. Investing in Pavement Condition can enhance the bicycle and pedestrian network. MnDOT will ensure that the dollars spent in System Stewardship achieve optimal outcomes through:
- Innovation: Developing new materials, design standards and procedures
- Low-cost maintenance and repairs: Using recycled materials, innovative design and preventive maintenance treatments to extend the useful life of infrastructure without increasing costs
- Alternate bidding: Planning for two comparable repair strategies (concrete versus bituminous) for some projects so contractors can bid the most cost-effective solution
In addition to capital investments, MnDOT will continue to use planning and research to guide its stewardship of state highway assets. MnDOT recently updated its risk-based Transportation Asset Management Plan (TAMP) in 2022. The plan helps MnDOT coordinate pavement, bridge and roadside infrastructure investments in order to make the most effective use of limited dollars and maximize asset life.
Investment Priorities
Figure 6-3 shows that System Stewardship is expected to constitute approximately 61% ($22.4 billion) of MnDOT’s overall program for the 20-year planning period of MnSHIP.
Figure 6-3: System Stewardship Investments in MnSHIP
Pavement Condition
Pavement Condition investments include preventive maintenance, overlays, mill and overlays, concrete pavement repair and reconstruction of existing roads.
Project Selection
MnDOT uses its Pavement Management System to predict future pavement conditions and develop a list of suggested fixes on NHS and non-NHS routes. The system uses funding assumptions based on statewide investment goals established in MnSHIP. The management system creates a preliminary 10-year list of potential projects. Projects on the NHS are selected through the Statewide Performance Program to achieve statewide outcomes on the NHS. MnDOT districts then modify the list based on a number of considerations such as local knowledge of conditions, input from stakeholders and timing of other projects in the area. The result is a list of projects that are included in the CHIP.
Districts also plan pavement improvements on non-NHS routes through the District Risk Management Program. In this program, the districts have more flexibility to set priorities for non-NHS pavement projects provided that the projects collectively meet the MnSHIP investment guidance.
The SPP and DRMP is currently under review by MnDOT’s Programming Update Workgroup. Changes to this process are expected within the next year.
Outcomes
Overall, MnDOT expects that the miles of pavement in poor condition will increase significantly by the end of the 20-year planning period, particularly on lower volume roadways. Interstate pavements are expected to meet MnDOT targets for good and poor and the federal minimum thresholds. Pavement condition is expected to decline due to two key factors: 1) current pavement condition is very good, and 2) the age of Minnesota’s roadways, many of which were constructed more than 40 years ago and require more expensive fixes.
The percentage of pavement in good and poor condition and the percentage of vehicle miles travelled (VMT) on poor roads is expected to be as follows in 2042:
- Interstate pavements: 86% good and 2% poor
- 5% of VMT on poor roads
- Will meet MnDOT good target (70% or more good)
- Will meet MnDOT poor target (2% or less poor)
- Is expected to meet federal minimum thresholds through 2042
- Other NHS pavements: 91% good and 6% poor
- 3% of VMT on poor roads
- Will meet MnDOT good target (65% or more good)
- Will not meet MnDOT poor target (4% or less poor)
- Non-NHS pavements: 89% good and 10% poor
- 6% of VMT on poor roads
- Will meet MnDOT good target (60% or more good)
- Will not meet MnDOT poor target (8% or less poor)
Equity Evaluation
MnDOT reviewed the investment for each category through an equity lens. With an Equity Work Group, MnDOT staff discussed the potential benefits from the MnSHIP investment direction and potential burdens resulting from that investment. Potential benefits of pavement investment include:
- Provides an opportunity to improve roadway conditions and design
- May provide benefits to lower income communities and on tribal lands where roadways were under designed without/narrow shoulders or safe places for walking/biking
Potential burdens of pavement investment include:
- Prioritizing pavement condition may steer more investment to less expensive fixes on rural roadways and away from more investment in urban areas
- Pavement investment strategy maintains the existing roadway footprint without considering whether the existing roadway is overbuilt and the possibility of reducing lane miles
Risk Management Results
The Pavement Condition workgroup identified highway capital risks related to state highway pavements. These risk statements were scored for likelihood and impact (high, medium, low) based on MnDOT’s current investment approach and the investment direction in this plan. Each risk statement and its respective score is shown in Figure 6-4.
Figure 6-4: Pavement Risk Management Results
| Risk Statement | Risk Level Current Approach | Risk Level with MnSHIP Investment Direction |
|---|---|---|
| Increase in poor pavement condition requiring more maintenance projects | High | High |
| Increase costs to users from poor pavement quality | Medium | Medium |
| Maintenance budgets require more reactive repairs due to lack of capital investment | High | Medium |
| Inability to meet federal legislative requirements/performance thresholds | Low | Low |
| Inability to invest in more long-term pavement projects at the right time | Medium | Medium |
| Not meeting public expectations for roadway conditions | Medium | Medium |
Pavement risk levels generally do not change compared to the current investment approach. Pavements are MnDOT’s largest and most expensive asset to maintain. It takes a large amount of investment to appreciably change outcomes.
System Investment Strategies
MnDOT may implement any of the following strategies to address the risks that remain with the level of investment in Pavement Condition:
- Focus on preventive maintenance activities to keep good pavements in good condition
- Use of operational budget for maintenance of pavements
- Apply a mix of fixes to extend useful life and reduce life-cycle costs
Bridge Condition
Bridge Condition includes the replacement, repair and maintenance of bridges.
Project Selection
As is the case with Pavement Condition, MnDOT prioritizes more investments in Bridge Condition on NHS roads than on non-NHS state highways.
MnDOT determines which bridges to invest in based on the Bridge Office Replacement and Improvement System (BORIS) analysis and prioritization tool which assesses bridge condition, traffic demand, criticality and other structural ratings to determine bridges in greater need of investment. Experts from the Bridge Office, District bridge engineers and District planners then decide which bridges need to receive future investment and when to program those investments.
Outcomes
Bridge conditions on the NHS will be maintained over the next 20 years. Non-NHS condition will worsen overall. However, the projected condition of NHS and bridges is expected to meet the federal minimum thresholds and MnDOT targets for percent poor. The percentage of bridges in poor condition on the non-NHS and good condition for both systems are not expected to meet targets.
The percentage of bridge deck area in good and poor condition is expected to be as follows in 2042:
- NHS Bridges: 53% good and 5% poor
- Will likely meet MnDOT poor target (5% or less poor)
- Will likely not meet MnDOT good target (55% or more good)
- Will likely meet the federal minimum threshold (10% or less poor)
- Non-NHS bridges: 42% good and 10% poor
- Will likely not meet MnDOT poor target (8% or less poor)
- Will likely not meet MnDOT good target (50% or more good)
Equity Evaluation
MnDOT reviewed the investment for each category through an equity lens. With an Equity Work Group, MnDOT staff discussed the potential benefits from the MnSHIP investment direction and potential burdens resulting from that investment. Potential benefits of Bridge Condition investment include providing opportunities for more replacement/redesign of bridges to incorporate improved connections for all modes.
Risk Management Results
The Bridge Condition workgroup identified highway capital risks related to state highway bridges. These risk statements were scored for likelihood and impact (high, medium, low) based on MnDOT’s current investment approach and the investment direction in this plan. Each risk statement and its respective score is shown in Figure 6-5.
Figure 6-5: Bridge Condition Risk Management Results
| Risk Statement | Risk Level Current Approach | Risk Level with MnSHIP Investment Direction |
|---|---|---|
| Increased number of bridges deteriorate into poor condition | Medium | Low |
| Bridge investment needs are continually deferred | Medium | Low |
| Unable to make timely and appropriate fixes during a bridge’s lifespan | Medium | Medium |
| Inability to meet performance thresholds outlined in federal legislation | Medium | Low |
| Additional non-bridge needs driving the replacement of a bridge sooner than the end of the bridge’s life | Low | Medium |
The MnSHIP investment direction substantially increases investment in Bridge Condition. This increased investment results in lowered risk levels for most bridge-related risks. In particular, bridge condition performance risks drop to low levels with the MnSHIP investment direction.
System Investment Strategies
MnDOT may implement any of the following strategies to address the risks that remain with the level of investment in Bridge Condition:
- Perform maintenance activities focused on preventive repairs
- Complete individual bridge management plans for high priority preservation bridges
- Evaluate deterioration models and performance targets to better forecast investment needs
Roadside Infrastructure
Roadside Infrastructure elements include culverts, traffic signals, signs, lighting, retaining walls, fencing, noise walls, guardrails, overhead structures, ITS and pavement markings.
Project Selection
MnDOT often repairs or replaces roadside infrastructure as part of a larger pavement, bridge or intersection project. Sometimes MnDOT carries out corridor-wide, stand-alone roadside infrastructure projects for assets such as culverts, signage or lighting. Roadside infrastructure damaged from weather or vehicle impacts are usually repaired as part of routine maintenance and funded through the operations and maintenance budget.
Outcomes
In general, by 2042, the condition of the system’s roadside infrastructure elements is expected to decline substantially. However, NHS routes will receive more frequent upgrades to roadside infrastructure elements compared to non-NHS routes due to the relative frequency of pavement and bridge projects.
The percentage of roadside infrastructure in poor condition is expected to be as follows in 2042:
- Culverts: 36% poor
- Will not meet target (10% or less poor)
- Deep Storm Water Tunnels:0% poor
- Will meet target (10% or less poor)
- Lighting: 25-30% beyond useful life
- Will not meet target (2% beyond useful life)
- Noise Walls: 22% poor
- Will not meet target (8% or less poor)
- Overhead Signs (structure only):20-25% poor
- Will not meet target (6% or less poor)
- Signals: 30-35% beyond useful service life
- Will not meet target (2% or less poor)
In addition to the roadside infrastructure assets listed above, MnDOT invests in ITS assets that have varying performance targets, retaining walls that have targets based on inspections, and pavement marking and traffic barriers which do not have an established performance target.
Equity Evaluation
MnDOT reviewed the investment for each category through an equity lens. With an Equity Work Group, MnDOT staff discussed the potential benefits from the MnSHIP investment direction and potential burdens resulting from that investment. Specific benefits and burdens for Roadside Infrastructure were not identified.
Risk Management Results
The Roadside Infrastructure workgroup identified highway capital risks related to roadside infrastructure assets. These risk statements were scored for likelihood and impact (high, medium, low) based on MnDOT’s current investment approach and the investment direction in this plan. Each risk statement and its respective score is shown in Figure 6-6.
Figure 6-6: Roadside Infrastructure Risk Management Results
| Risk Statement | Risk Level Current Approach | Risk Level with MnSHIP Investment Direction |
|---|---|---|
| Equipment/systems exceeds service life or are damaged and are no longer functional | High | High |
| Reduction in replacement and repair | Medium | Medium |
| Delayed replacement and repair cycles not aligned with optimal life-cycle | Medium | Medium |
| Inability to adapt to climate change and extreme weather events | Medium | Medium |
| Risk of technology, material and installation obsolescence and inability to modernize the system | Medium | Medium |
Roadside Infrastructure risk levels do not change from the current approach as the funding level is similar. MnSHIP investment in the Climate Resilience investment category will likely reduce the Roadside Infrastructure risk of inability to adapt to climate change and extreme weather events. Remaining risks are high and medium for Roadside Infrastructure. This is an investment category that has a relatively high unmet need. Many assets are expected to deteriorate over the MnSHIP planning period.
System Investment Strategies
MnDOT may implement any of the following strategies to address the risks that remain with the level of investment in Roadside Infrastructure:
- Repair and replace infrastructure in poor condition or infrastructure beyond its service life
- Replace infrastructure with greatest exposure to the traveling public, mostly through pavement and bridge projects
- Apply the risk mitigation strategies identified in the Transportation Asset Management Plan
- Institute a ten-year cycle of inspections for retaining walls to ensure that they meet the performance target
Rest Areas
Rest Areas investment category includes the repair and maintenance of existing state highway rest area buildings, sites and parking lots including investments to make them compliant with the Americans with Disabilities Act.
Project Selection
The Safety Rest Area Program funds construction, repair and rehabilitation of rest areas and waysides. Candidate projects are identified based on the physical condition of rest area buildings and pavements, accessibility and building code compliance, partnership potential and availability of alternative funding sources. MnDOT Districts may also identify rest area capital investment projects. These typically focus on the physical condition of rest area vehicular pavements and ramps. These projects typically use one-time funding.
Outcomes
With increased investment in rest areas in MnSHIP, ADA compliance will be addressed at all rest area locations by the end of the plan. The percentage of facilities needing significant renovation or replacement is projected to increase to 16% poor, above the MnDOT target.
Equity Evaluation
MnDOT reviewed the investment for each category through an equity lens. With an Equity Work Group, MnDOT staff discussed the potential benefits from the MnSHIP investment direction and potential burdens resulting from that investment. Potential benefits of Rest Areas investment include providing funding to make rest area buildings and sites to be accessible for people with disabilities.
Risk Management Results
The Rest Areas workgroup identified highway capital risks related to MnDOT rest areas. These risk statements were scored for likelihood and impact (high, medium, low) based on MnDOT’s current investment approach and the investment direction in this plan. Each risk statement and its respective score is shown in Figure 6-7.
Figure 6-7: Rest Areas Risk Management Results
| Risk Statement | Risk Level Current Approach | Risk Level with MnSHIP Investment Direction |
|---|---|---|
| Potential closure of rest areas due to decreased replacement and renovation creating unsafe conditions | High | Medium |
| Inability to make appropriate and timely repairs | Medium | Medium |
| Inability to meet state of good repair for rest areas through capital funding | Medium | Low |
| Fewer rest area reconstruction projects to address non-compliant ADA infrastructure | Medium | Low |
Risks related to rest areas are reduced substantially with the MnSHIP investment direction. This reflects increased investment in Rest Areas, particularly related to ADA compliance. This investment will address Rest Areas’ biggest needs and risks.
System Investment Strategies
MnDOT may draw from the following strategies, when necessary, to prioritize projects and address risks that are associated with Rest Areas:
- Prioritize health- and safety-related repairs to rest areas unless replacement is warranted
- Prioritize ADA improvements
- Coordinate rest area improvements with truck parking improvements and pavement projects
Climate Action
Following the policy direction in the SMTP, MnSHIP includes an objective area and investment category related to Minnesota’s changing climate. Investments in other categories may also help with climate resilience but investments in this area are specifically to address Minnesota’s changing climate.
Investment Priorities
As shown in Figure 6-8, MnDOT anticipates spending approximately 1.5% of its program on Climate Action for the 20-year planning period of MnSHIP.
Figure 6-8: Climate Action Investments in MnSHIP

Climate Resilience
Climate resilience includes four different strategies. They are:
- Flood mitigation projects
- Proactive resilient infrastructures
- Snow fence projects
- Planting and implementation of green assets
Project Selection
Snow fence projects and green asset investment are identified and prioritized by the MnDOT districts. These investments are often completed as part of a pavement or bridge project. Snow fences can also be implemented as a standalone project.
Flood mitigation projects and resilient infrastructure projects may also be completed in conjunction with a pavement or bridge project. These investments are more likely to be standalone projects. The resilient infrastructure investment is new with this plan, so project selection details are still being determined.
Outcomes
Outcomes related to climate change are extremely difficult to forecast. MnDOT has not identified specific performance measures for capital investments in this area. With the investment direction in MnSHIP, the following climate resilience investments will be completed:
- Up to 10 flood mitigation projects
- 10-20 climate resilient projects per year
- 10-20% of highway culverts with climate resilience enhancements
- 400-500 snow trap sites addressed
- Majority of trees on construction projects replaced and 100-200 miles of roadway with new or improved green infrastructure
Equity Evaluation
MnDOT reviewed the investment for each category through an equity lens. With an Equity Work Group, MnDOT staff discussed the potential benefits from the MnSHIP investment direction and potential burdens resulting from that investment. Potential benefits of Climate Resilience investments include:
- Green infrastructure will be focused in urban areas that may be more affected by climate change – high priority areas would need to be selected based on various safety, health, and equity criteria
- Improvements after highway projects such as replacing/adding more trees and incorporation of native plantings and seeding can restore/improve environment around highways and benefit local communities
Potential burdens of Climate Resilience investments include:
- Limitations on the use of state highway funds within right-of-way limits restorations and broader benefits to the surrounding communities
Risk Management Results
The Climate Resilience workgroup identified highway capital risks related to Minnesota’s changing climate. These risk statements were scored for likelihood and impact (high, medium, low) based on MnDOT’s current investment approach and the investment direction in this plan. Each risk statement and its respective score is shown in Figure 6-9.
Figure 6-9: Climate Resilience Risk Management Results
| Risk Statement | Risk Level Current Approach | Risk Level with MnSIHP Investment Direction |
|---|---|---|
| More frequent service interruptions and road closures | High | High |
| Local economies and communities could see increased vulnerability due to increases in extreme weather events | High | Medium |
| Increased extreme weather events (flash flooding, snow drifts, etc.) cause dangerous conditions on roadways | High | Medium |
| MnDOT roadway and drainage systems could cause flooding on private properties | Low | Low |
| MnDOT may not maximize the health of Minnesota’s people, environment and economy | High | Medium |
Four out of five risks drop from a high risk to a medium risk with investment in this category. This reflects the increased investment for Climate Resilience in this plan.
System Investment Strategies
MnDOT may draw from the following strategies, when necessary, to prioritize projects and address risks that are associated with lower performance or investment in Climate Resilience:
- Coordinate on planned and programmed projects to identify resilience needs
- Implement priorities identified in the Resilience Improvement Plan and the Carbon Reduction Strategy
- Implement priorities identified in the SMTP
- Implement actions in the 2022 Minnesota Climate Action Framework
Transportation Safety
Funding for Transportation Safety in MnSHIP will allow MnDOT to continue its comprehensive approach to improving safety on state highways for all users. Since the last MnSHIP was completed, traffic fatalities and serious injuries have spiked, sparking an increased attention on traffic safety. The MnSHIP investment direction increases investment in traffic safety improvements.
Investment Priorities
As shown in Figure 6-10, MnDOT anticipates spending approximately 3.7% of its program on Transportation Safety for the 20-year planning period of MnSHIP.
Figure 6-10: Transportation Safety Investment in MnSHIP
Transportation Safety
As described in Chapter 1: Plan Overview, MnDOT currently uses a combination of three types of safety investments in its effort to improve safety and reduce the number of fatalities and serious injuries on Minnesota roads:
- Proactive lower cost, high-benefit safety features
- Improvements at sustained crash locations
- Investments and coordination as part of the Towards Zero Deaths initiative
MnDOT funds many of these improvements through the Highway Safety Improvement Program, a federal program that emphasizes data-driven, strategic approaches to improving highway safety. HSIP projects correct a hazardous road location or address a fatal and serious injury crash problem. The Transportation Safety category also includes non-motorized safety improvements and other standalone safety investments beyond HSIP.
Project Selection
MnDOT currently includes safety improvements as a part of pavement and bridge projects. As these projects are developed, safety improvements are identified which could be made in conjunction with the project. MnDOT also funds safety investments on state highways through HSIP, a federal program. These funds are distributed among MnDOT Districts and local agencies. Project identification and selection for the non-motorized safety improvements and additional safety improvements in the MnSHIP investment direction are still being determined but will include coordination between the districts and Office of Traffic Engineering.
Outcomes
Safety outcomes are inherently difficult to project but MnDOT can estimate crash reduction factors for specific improvements at specific locations. The additional safety investment beyond HSIP will allow MnDOT to address roughly 40 intersections and 50 miles of highway segments with high crash rates. If these improvements are successful, MnDOT would be able to save 30-50 lives and prevent 60-100 serious injuries from happening on state highways. Investments in non-motorized safety would prevent 100-200 serious or fatal pedestrian/bicycle crashes from occurring. MnDOT districts will continue installing safety features through HSIP and as part of pavement projects.
Equity Evaluation
MnDOT reviewed the investment for each category through an equity lens. With an Equity Work Group, MnDOT staff discussed the potential benefits from the MnSHIP investment direction and potential burdens resulting from that investment. Potential benefits for the non-motorized safety program include:
- Provides benefits for those who don’t drive, either by choice or by circumstance through adding connections and improving safety along and across highways
- Investment need calculation incorporated priorities based on equity considerations
Risk Management Results
The Transportation Safety workgroup identified highway capital risks related to highway safety. These risk statements were scored for likelihood and impact (high, medium, low) based on MnDOT’s current investment approach and the investment direction in this plan. Each risk statement and its respective score is shown in Figure 6-11.
Figure 6-11: Transportation Safety Risk Management Result
| Risk Statement | Risk Level Current Approach | Risk Level with MnSHIP Investment Direction |
|---|---|---|
| Inability to implement new proactive safety treatments | Medium | Low |
| Reduced educational or enforcement programs like MnDOT's TZD program | Medium | Low |
| Limited ability to invest in pedestrian and bicycle infrastructure | Medium | Low |
| New and existing safety infrastructure may not be able to be maintained due to limited maintenance budgets | Low | Medium |
| An increase in safety investments and infrastructure requiring additional staff time and agency resources | Low | Medium |
Three risks drop from medium to low. The increased investment reduces MnDOT’s risks related to transportation safety. The final two risks go up with additional investment. This reflects the staffing and maintenance needs for new safety infrastructure.
System Investment Strategies
MnDOT may draw from the following strategies, when necessary, to prioritize projects and address risks that are associated with lower performance or investment in Transportation Safety:
- Invest in high priority, lower cost proactive projects such as rumble strips, high tension cable barrier and intersection lighting
- Reactively install roundabouts and J-turns at sustained crash locations
- Implement non-motorized safety countermeasures at priority locations
- Modify the design of highways for appropriate speeds based on land use context and user needs
Advancing Technology
Advancing Technology includes investments in Intelligent Transportation Systems (ITS), Transportation System Management and Operations and Connected and Automated Vehicles. Investments in this category expand technology infrastructure to address transportation safety and mobility needs.
Project Selection
Most advancing technology investments are prioritized and selected through the ITS solicitation. Each year, districts apply for funding for ITS projects. The Office of Traffic Engineering scores and selects projects. MnDOT also funds the CAV-X office to plan for and implement strategies and capital investments to prepare Minnesota’s roadways for the widespread adoption of connected and automated vehicle technology.
Outcomes
Outside of ITS infrastructure condition, MnDOT does not have adopted performance measures or targets related to advancing technology. The investment in this category will expand ITS to 200-250 miles of state highways and address immediate and medium needs for fiber network expansion.
Equity Evaluation
MnDOT reviewed the investment for each category through an equity lens. With an Equity Work Group, MnDOT staff discussed the potential benefits from the MnSHIP investment direction and potential burdens resulting from that investment. Specific benefits and burdens for Advancing Technology investment were not identified.
Risk Management Results
The Advancing Technology workgroup identified highway capital risks related to technology on state highways. These risk statements were scored for likelihood and impact (high, medium, low) based on MnDOT’s current investment approach and the investment direction in this plan. Each risk statement and its respective score is shown in Figure 6-12.
Figure 6-12: Advancing Technology Risk Management Results
| Risk Statement | Risk Level Current Approach | Risk Level with MnSHIP Investment Direction |
|---|---|---|
| Inability to keep pace with shifts in technology | Medium | Medium |
| Inadequate funding for maintaining technology assets | Medium | Medium |
| Limited implementation and piloting of CAV technology | Medium | Medium |
| Lack of investments in technology on state highway system | Medium | Medium |
| Lack of available funding leading to unequal technology investment across the state | Low | Low |
Risks related to advancing technology did not change from the current investment approach. This reflects minimal changes to the investment types and amounts for advancing technology in MnSHIP versus the existing approach.
System Investment Strategies
MnDOT may implement any of the following strategies to address the risks that remain with the level of investment in Advancing Technology:
- Traveler information: Provides current and anticipated travel and weather conditions, route and mode options (and other information) via dynamic message signs, 511, web, social media and text
- Invest in road weather management systems
- Utilize traffic signal optimization currently available
- Develop adaptive ramp optimization and monitoring
Critical Connections
Critical Connections includes mobility investments for many types of highway users, including those driving motor vehicles, freight carriers, bicyclists and pedestrians. MnSHIP’s investment categories within Critical Connections recognize the importance of the multimodal connections detailed in the Statewide Multimodal Transportation Plan. The Highway Mobility and Freight investment categories improve mobility for drivers and freight carriers. Safe walking and bicycling networks are necessary for the mobility of all Minnesotans, and Pedestrian and Bicycle investments help MnDOT make progress toward this objective. MnDOT’s Critical Connections investment strategies seek to increase options, improve travel time reliability and reduce excessive delay, while reducing the average amount of driving Minnesotans need to access the goods, services and opportunities important to their quality of life. Investment categories in the Critical Connections objective area received substantial increases in investment from the previous plan. This increased investment will allow MnDOT to improve mobility for state highway users, particularly pedestrians and bicyclists.
Investment Priorities
Critical Connections is expected to constitute 8.4% of MnDOT’s investment through all years of the plan (Figure 6-13).
Figure 6-13: Critical Connections Investment in MnSHIP
Highway Mobility
The Highway Mobility investment category focuses on improving the movement of people and freight on the NHS. MnDOT’s strategy for maintaining travel reliability in the Twin Cities metropolitan area has moved away from traditional highway expansion. The investments in this category follow a tiered, phased approach focused on implementing lower cost, spot improvements and transit-supportive investments. Highway Mobility strategies include four types of mobility improvements:
- Active Traffic Management (ATM), Travel Demand Management (TDM) and transit-supportive investments (Twin Cities Metro)
- Spot mobility improvements
- Managed lanes (Twin Cities Metro)
- Strategic capacity investments
The investment strategies for Highway Mobility in the Twin Cities region align with the investment direction established in the Metropolitan Council’s 2040 Transportation Policy Plan and the SMTP. The MnSHIP investment direction funds ATM, spot mobility improvements and managed lanes but does not fund strategic capacity investments. Capacity expansion projects are expensive and may hinder MnDOT from meeting its goal for reduction of vehicle miles travelled as mentioned in Chapter 2: Existing Conditions and Trends. Capacity expansion projects on the state highway system may be funded through other programs like Corridors of Commerce or through the Metropolitan Council’s regional solicitation. MnDOT also supports TDM initiatives led by local and regional agencies that may not be eligible for state highway investment.
Project Selection
Within the Twin Cities, mobility projects are selected based on asset management and return on investment criteria, along with priority in regional plans and studies. Direction for the latter comes from the Metropolitan Council’s 2040 Transportation Policy Plan and various region-wide system studies, such as the Principal Arterial Intersection Conversion Study and the MnPASS (now E-ZPass) System Study. Standalone mobility projects in Greater Minnesota are chosen by individual MnDOT districts and emphasize criteria based on safety and travel time reliability. These project locations have been identified and prioritized in the Greater Minnesota Mobility Study.
In addition to the Highway Mobility investment category, MnDOT selects projects for the Corridors of Commerce program. That program has its own legislatively directed funding and selection criteria that does not follow MnSHIP investment direction guidance. More information on Corridors of Commerce is available at its website.
In 2023, the Minnesota Legislature created new requirements for highway capacity expansion projects to be consistent with MnDOT’s targets for Greenhouse Gas emissions and per capita VMT. Any expansion project programmed after February 1, 2025 that is not consistent with those targets will need to have associated mitigation programmed.
Outcomes
MnDOT tracks federal performance measures for reliability on the NHS. MnDOT also recently adopted a vehicle miles travelled per capita target and a travel time delay performance measure and target for the Twin Cities area. The measures and targets are:
- 90% of person-miles traveled on the NHS are reliable
- 14% reduction in VMT per capita by 2040 (compared to 2019)
- 9 minutes of delay per person in the Twin Cities
Based on the investment direction in MnSHIP, MnDOT will be able to address travel delay in the Twin Cities region at specific locations. Delay for most state highway users will increase from current levels. Over the 20-year plan period, MnDOT and the Metropolitan Council will invest in Highway Mobility to implement the following:
- Build out the traffic management system
- Support 10 arterial Bus Rapid Transit lines on state highways
- Complete over 100 spot mobility improvements
- Add managed lanes on four corridors
While these projects will help improve travel reliability and mitigate travel delay, delay is still anticipated to worsen through 2042 relative to today due to anticipated regional growth and the related increase in mobility needs across the system. Delay in the Twin Cities metro is expected to rise from 9.7 minutes per person per weekday (in 2018) to 11-12 minutes per person per weekday by the end of the plan. Shifts in travel behavior including continued teleworking, use of transit and increase in bicycling and walking could significantly change these anticipated outcomes.
Mobility investments in Greater Minnesota can complete improvements at up to 50 locations on the NHS. These improvements will address the biggest mobility issues at specific locations. In addition, other funding such as Corridors of Commerce and federal competitive solicitations may fund larger expansion projects in Greater Minnesota. Due to these investments, it is anticipated that travel time reliability in Greater Minnesota will remain stable over the MnSHIP planning period.
Equity Evaluation
MnDOT reviewed the investment for each category through an equity lens. With an Equity Work Group, MnDOT staff discussed the potential benefits from the MnSHIP investment direction and potential burdens resulting from that investment. Potential benefits of Highway Mobility investments include:
- Transit-supportive (bus shoulders/ramps, transit signal priority, safety enhancements) and managed lane investments provide advantages for transit users which historically made up of a higher percentage of lower income populations than the overall population
Potential burdens include:
- Expansion benefits those with cars and those traveling through a community, not those living near the state highway
- Added lanes can burden communities near roadways through an increase air pollution, noise pollution, and can induce demand and traffic to surrounding area
- Adding a lane can mean taking property from communities that have been harmed in the past
Overall, there are more investments in Highway Mobility that add or continue burdens rather than address inequities.
Risk Management Results
The Highway Mobility workgroup identified highway capital risks related to the movement of people and goods on the NHS. These risk statements were scored for likelihood and impact (high, medium, low) based on MnDOT’s current investment approach and the investment direction in this plan. Each risk statement and its respective score is shown in Figure 6-14.
Figure 6-14: Highway Mobility Risk Management Results
| Risk Statement | Risk Level Current Approach | Risk Level with MnSHIP Investment Direction |
|---|---|---|
| MnDOT may not address local and regional partner mobility priorities and the legislature directs funding toward capacity projects | High | Medium |
| Undesirable delay could increase with rising travel demand | Medium | Medium |
| Congestion hinders development of reliable and efficient transit service | Medium | Medium |
| The Twin Cities region may be unable to adapt to shifting travel and land use patterns | Medium | Low |
| Less predictable travel times and unstable traffic flow at key locations on the NHS | Medium | Low |
| Increased congestion could result in less reliable trips for freight carriers | Medium | Low |
| Unstable traffic flow at certain locations may raise the risk of crashes | High | Medium |
| Investment approach may over-build capacity that doesn’t match future travel demand | Low | Low |
| Current investment approach focused on car-centric mobility may create induced demand | Low | Medium |
Highway mobility investment in this plan is substantially increased over current investment levels. That investment reduces remaining risk, particularly on the NHS in Greater Minnesota. Three risks drop to low and no risk remains at a high level with this investment. The risk related to induced demand rises to a medium risk with this investment approach. At higher levels of investment in Highway Mobility, that risk increases. The MnSHIP investment direction focus on spot mobility improvements and transit-supportive investments mitigates potential induced demand from investments in this category.
System Investment Strategies
MnDOT may draw from the following strategies, when necessary, to prioritize projects and address risks that are associated with lower performance or investment in Highway Mobility:
- Focus on low-cost spot mobility projects that provide safety benefits and reduce delays
- Focus on investments that provide reliable congestion-free options on Twin Cities metro area corridors
- Focus investment to improve travel time reliability through operational improvements such as upgraded traffic signals, ITS, turn lanes and passing lanes
- Support TDM strategies led by local and regional partners
Freight
The Freight category includes projects that are eligible for funding as part of the National Highway Freight Program. These include addressing freight bottlenecks, freight safety and mobility improvements, first-last mile connections and intermodal freight improvements. Freight investments also include preservation and upgrades for truck weigh stations, at-grade rail crossings on the state highway system and truck parking at the state’s rest areas.
Project Selection
Highway freight projects are selected through the Minnesota Highway Freight Program (MHFP), which allocates federal funding for freight. The MHFP selects projects through a solicitation process that includes three project categories:
- Safety
- Congestion/efficiency improvements
- First/last mile connections
Allocation of funds between these three categories is based on the investment direction in the Minnesota Statewide Freight System and Investment Plan. Weigh station and weight enforcement projects are selected through the Weigh Station Capital Improvement Program with input from MnDOT District offices and the Weight Enforcement Unit of the Minnesota State Patrol. Projects are identified and prioritized for the Capital Improvement Program based on a number of scoring criteria, including condition, geographic coverage, freight considerations, roadway characteristics and enforcement and safety criteria.
State highway rail crossing projects are selected through the Railway-Highway Crossings program which solicits projects annually from local road authorities, railroads and MnDOT districts. The program includes three project categories: closures/consolidations, antiquated equipment and grade crossing control.
Outcomes
Truck Travel Time Reliability Index (TTRI) is a performance measure that MnDOT monitors and is a required federal performance measure. TTTRI measures the variation in commercial truck travel times on the Interstate system. MnDOT cannot project this measure into the future. Currently, MnDOT is meeting the federal target for TTRI. Investment in the Freight category remained relatively flat from the current investment approach but includes an increased investment in truck parking expansion. With investment in Freight, MnDOT will be able to achieve the following:
- 60-100 first/last mile or freight safety improvements
- Maintain weigh stations so that none become obsolete
- Replace rail crossing signals at 3 locations per year and 1 passive crossing converted to active per year
- Expanded truck parking at 8-10 existing locations and add 2-3 new truck parking locations on MnDOT right-of-way
Equity Evaluation
MnDOT reviewed the investment for each category through an equity lens. With an Equity Work Group, MnDOT staff discussed the potential benefits from the MnSHIP investment direction and potential burdens resulting from that investment. Specific benefits and burdens for Freight investment were not identified.
Risk Management Results
The Freight workgroup identified highway capital risks related to freight movement in Minnesota. These risk statements were scored for likelihood and impact (high, medium, low) based on MnDOT’s current investment approach and the investment direction in this plan. Each risk statement and its respective score is shown in Figure 6-15.
Figure 6-15: Freight Risk Management Results
| Risk Statement | Risk Level Current Approach | Risk Level with MnSHIP Investment Direction |
|---|---|---|
| Reduced funding could affect MnDOT’s ability to fund freight improvements as part of existing or stand-alone projects | Low | Low |
| Reduced funding could lead to closing of weigh stations and the Department of Public Safety cannot perform necessary weight enforcement and safety inspections | Medium | Medium |
| Investment in weigh stations and weight enforcement may be below federal expectations | Medium | Low |
| Freight intermodal connectors may not be identified and adequately maintained | Low | Low |
Freight investment reduces risks slightly compared to the current approach. This reflects the similar investment in freight across the two approaches. At the end of the MnSHIP planning period, most freight related risks are rated low.
System Investment Strategies
MnDOT may draw from the following strategies, when necessary, to prioritize projects and address risks that are associated with lower performance or investment in Freight:
- Use public-private partnerships where possible
- Use advanced technology
- Integrate freight considerations in public agency decision-making
- Add truck parking at MnDOT-owned facilities
Pedestrian and Bicycle
Pedestrian and bicycle investments provide infrastructure for people to walk and bicycle safely along and across state highways. Examples of MnDOT investments include sidewalks, accessible curb ramps, accessible pedestrian signals at intersections, shared use paths or separated trails, bicycle lanes and grade-separated facilities.
Project Selection
Most improvements for people walking and bicycling on the state highway system are constructed as part of pavement and bridge projects. Following the complete streets approach, MnDOT evaluates options to improve the safety, efficiency and functionality of the highway system for people walking and bicycling on every project. Standalone pedestrian and bicycle projects are also occasionally funded, often in coordination with local agencies.
Each district has varying pedestrian and ADA infrastructure needs. The districts select their 10-year pedestrian investments based on planned bridge and pavement projects, ADA needs identified via MnDOT’s ADA Transition Plan and inventory and highest-risk pedestrian areas. Through collaboration between MnDOT districts and MnDOT’s ADA Unit, MnDOT identifies existing non-compliant sidewalks along any scheduled pavement or bridge project. MnDOT takes the opportunity to repair the sidewalk to bring it into compliance. Some additions of ADA-compliant facilities and elimination of pedestrian “gaps” are also completed where needed. Stand-alone ADA projects can also be selected to repair non-compliant sidewalks in locations where there is not an upcoming pavement or bridge project identified.
MnDOT District Bike Plans, completed in 2019, identify priority corridors for bicycle infrastructure investments and connections. Bicycle investments in MnSHIP are based on building out these corridors with a focus on improvements in urban areas.
Outcomes
MnDOT measures the condition of curb ramps and sidewalk (miles) and tracks the percentage that is compliant with ADA standards. MnDOT projects that the state highway system will be substantially compliant with ADA by 2037 including pedestrian bridges. In addition, MnDOT will be able to improve pedestrian facilities on 100-150 miles of roadway and at 200-250 intersections.
Bicycle infrastructure does not have a forecastable performance measure or target. Outcomes include progress towards implementing the District Bike Plans and supporting the SMTP target of 60% of Minnesotans bicycling or walking at least weekly. Bicycling infrastructure investments also support MnDOT’s long term goal of no one dying or being seriously injured while bicycling on the transportation system. With the bicycle investment identified in MnSHIP, MnDOT will be able to:
- Add over 150 miles of bicycle lanes and 20 miles of separated bicycle facilities in urban areas
- Add 10-15 miles of improvements along US bicycle routes in rural areas
- Maintain existing separated bicycle facilities and ramp connections
Equity Evaluation
MnDOT reviewed the investment for each category through an equity lens. With an Equity Work Group, MnDOT staff discussed the potential benefits from the MnSHIP investment direction and potential burdens resulting from that investment. Potential benefits of Pedestrian and Bicycle investments include:
- Provides benefits for those who don’t drive, either by choice or by circumstance through adding connections and improving safety along and across highways. Investment need calculation incorporated priorities based on equity.
- Addresses and rectifies the barriers caused by existing pedestrian infrastructure that is not compliant with ADA including sidewalks, curb ramps, and crossing signals
Potential burdens of Pedestrian and Bicycle investments include:
- Need to ensure benefits to communities living near improvement, not just those using facility to travel through – a bike path does not always translate to advancing equity
- Reaching ADA compliance by 2037 is too long of a wait and continues burdens until then
Overall, the Equity Work Group determined that implementation is key as to whether investments advance equity or continue burdens.
Risk Management Results
The Pedestrian and Bicycle workgroup identified highway capital risks related to walking and bicycle. These risk statements were scored for likelihood and impact (high, medium, low) based on MnDOT’s current investment approach and the investment direction in this plan. Each risk statement and its respective score is shown in Figure 6-16.
Figure 6-16: Pedestrian and Bicycle Risk Management Results
| Risk Statement | Risk Level Current Approach | Risk Level Current Approach |
|---|---|---|
| The state highway system presents a barrier to people who want to cross or travel along it | High | Medium |
| Limited investment in increased mobility options and increased system connections | Medium | Medium |
| Poor planning, design and/or construction of pedestrian assets | Medium | Medium |
| Not meeting federal compliance or the intent of ADA | Low | Low |
| Ad hoc investment based on pavement and bridge projects (bike) | Medium | Medium |
| Inability to maintain the system in good repair (bike) | Medium | Medium |
| Inability to invest in separated bicycle facilities and the recommended, context-appropriate facility as identified in the Statewide Bicycle System Plan | Medium | Medium |
Increased investment in pedestrian infrastructure reduces the highest risk of the state highway system being a barrier for people. The MnSHIP investment direction includes funding to fill gaps in the sidewalk system and address ADA issues with pedestrian bridges which should help reduce that risk. Most bicycle-related risk levels are similar to the current approach. The MnSHIP investment direction does not increase bicycle investment at the same level as pedestrian infrastructure. Bicycle investment has one of the highest unmet needs as described in Chapter 7: Unmet Needs.
System Investment Strategies
MnDOT may draw from the following strategies, when necessary, to prioritize projects and address risks that are associated with lower performance or investment in Pedestrian and Bicycle:
- Use Priority Areas for Walking Score (PAWS) and Suitability for the Pedestrian and Cycling Environment (SPACE) tool to prioritize locations for pedestrian and bicycle improvements
- Make pedestrian improvements via complete streets and to complete gaps in the network
- Focus 70% of bicycle investments in urban areas and 30% percent of investments in rural areas
- Add to existing bridge and pavement projects to improve safety and connectivity of the state bikeway system
Healthy Equitable Communities
Following the policy direction in the SMTP, MnSHIP includes an increased emphasis on equity. The Healthy Equitable Communities objective area includes two categories, Local Partnerships and Main Streets/Urban Pavements that aim to reduce disparities, enhance livability and partner with local communities. Although MnDOT pursues these objectives in all investment areas, these two categories are the primary outlet for collaboration with local agencies and to help meet local needs.
Investment Priorities
As shown in Figure 6-17, MnDOT anticipates spending approximately 5.2% of its program on Healthy Equitable Communities for the 20-year planning period of MnSHIP.
Figure 6-17: Healthy Equitable Communities Investments in MnSHIP

Local Partnerships
The Local Partnerships investments support local priorities on the state highway system where MnDOT partners with local communities to deliver improvements to the state highway system. These include landscaping/beautification projects, improvements supporting economic development, safety and improvements that help to integrate the highway into the local community and improve livability. The category also includes highway ownership realignment agreements where the roadway is transferred from one roadway authority to another.
Project Selection
The Local Partnership category is a collection of programs; each has its way of selecting projects. For example, roadway transfers rely on MnDOT negotiating with the receiving agency and restoring the road to an acceptable condition before transferring. The Transportation Economic Development (TED) program has a competitive application process that scores project economic benefits and trunk highway modifications. Landscaping agreements are contingent on location and available MnDOT funds. The Local Partnership Program is competitive and requires a selection committee, scoring criteria and various other factors. Livable Community partnerships are driven by the livability framework that prioritizes public health, environment, economics, sense of place, safety, meaningful physical, social, and cultural community connections, equity and community trust.
Outcomes
MnSHIP will invest nearly $1 billion in Local Partnerships through 2042. Most investments will be completed through the Local Partnership Program and partnering on locally-led projects on state highways. MnDOT does not have performance measures or targets related to partnering with communities. With investment in Local Partnerships, MnDOT will be able to:
- Fund 40 large TED projects or 350 smaller projects, which may support the creation and retention of an estimated 20,000 to 55,000 jobs throughout the state
- Fund 550-650 local partnership projects
- Partner on 15-20 locally-led projects on state highways
- Transfer an additional 70 miles of roadway
- Complete 1-3 small cap or stitch projects over state highways and up to 100 smaller under-bridge improvements
Equity Evaluation
MnDOT reviewed the investment for each category through an equity lens. With an Equity Work Group, MnDOT staff discussed the potential benefits from the MnSHIP investment direction and potential burdens resulting from that investment. Potential benefits of Local Partnerships investments include:
- Reduces system size and future maintenance burden allowing for more investment towards priorities that better advance equity
- Provides additional opportunity for improvements especially in urban areas where a MnDOT project may not be upcoming
- Potential benefits in partnering on locally-led projects and investment targeting urban areas
Potential burdens include:
- Differing visions and interest between MnDOT and local partners can lead to inability to advance equity and can continue inequitable outcomes
Risk Management Results
The Local Partnerships workgroup identified highway capital risks related to community priorities, livability and equity. These risk statements were scored for likelihood and impact (high, medium, low) based on MnDOT’s current investment approach and the investment direction in this plan. Each risk statement and its respective score is shown in Figure 6-18.
Figure 6-18: Local Partnerships Risk Management Results
| Risk Statement | Risk Level Current Approach | Risk Level with MnSHIP Investment Direction |
|---|---|---|
| Inability to capitalize on opportunities to advance economic competitiveness and address local priorities | Medium | Medium |
| Continue to manage roadways which could be more effectively managed by local governments | Medium | Medium |
| Funding unavailable to facilitate an agreed transfer with local governments | Medium | Medium |
Despite increased investment in Local Partnerships, the risk levels do not change from the current approach. This reflects the limited increase in jurisdictional transfer investments that aligns with the final two risks.
System Investment Strategies
MnDOT may draw from the following strategies, when necessary, to prioritize projects and address risks that are associated with lower performance or investment in Local Partnerships:
- Maintain the TED program
- Expand partnerships with local agencies/communities that leverage funds to complete larger projects
Main Streets/Urban Pavements
Investment in Main Streets/Urban Pavements provides additional funding for projects in cities and towns to deliver more improvements along state highways. This includes segments of the state highway that are non-freeways and function both as a state highway and as a city street in an urban context. Additional improvements addressed could be local utilities under the road, drainage infrastructure, a longer-term ADA fix, or redesigning the roadway to meet the community’s quality of life, and transportation equity needs. Specifically, the Main Streets/Urban Pavements funding covers additional pavement costs related to adding a project in an urban area or changing the scope of a planned pavement resurfacing project to allow more substantial work in conjunction with the project.
Project Selection
This is a new investment category. The project identification and selection process has not begun for these investments. The section below describes how the process will work in the future.
Urban pavement projects are selected based on predicted pavement condition, other infrastructure needs in a community and how substantial a fix the pavement surface requires. District staff will work with the Materials Office and MnDOT’s ADA unit to determine the best location for Main Streets/Urban Pavements funding. Oftentimes, this will involve adding funding to an existing urban pavement project to address other needs. In other locations, Districts may add a new urban pavement project with this funding.
Outcomes
MnDOT will be able to track the outcome of Main Streets/Urban Pavements investment by how many selected projects would be upgraded to complete, holistic projects and how many additional unselected candidate locations become funded projects. With the MnSHIP investment, MnDOT will be able to address 125-145 candidate urban locations in Minnesota (note more than one candidate location may be in the same city). These investments may improve the pavement outcomes described previously under the Pavement Condition investment category.
MnDOT also measures the condition of curb ramps and sidewalk (miles) and tracks the percentage that is compliant with ADA standards as a part of Pedestrian and Bicycle investment. ADA compliance is a federal law that ensures accessibility for people with disabilities. Tracking ADA compliance as a part of implementation will also show the effectiveness of Main Streets/Urban Pavement investments.
Equity Evaluation
MnDOT reviewed the investment for each category through an equity lens. With an Equity Work Group, MnDOT staff discussed the potential benefits from the MnSHIP investment direction and potential burdens resulting from that investment. Potential benefits of Main Streets/Urban Pavements investments include:
- Ability to address local safety concerns, improve/add non-motorized infrastructure, urban aesthetic improvements for the surrounding community
- Helps mitigate/balance pavement projects between rural and urban
Risk Management Results
The Main Streets/Urban Pavements workgroup identified highway capital risks related to state highway pavements in urban areas. These risk statements were scored for likelihood and impact (high, medium, low) based on MnDOT’s current investment approach and the investment direction in this plan. Each risk statement and its respective score is shown in Figure 6-19.
Figure 6-19: Main Streets/Urban Pavements Risk Management Results
| Risk Statement | Risk Level Current Approach | Risk Level with MnSHIP Investment Direction |
|---|---|---|
| Inability to capitalize on opportunities to advance health, transportation options and address local priorities | High | Medium |
| Growth in unaddressed improvements from under investing in Urban Pavements/Main Streets | High | Medium |
| Unable to prevent deferring ADA improvements with pavement projects and making more long-term ADA improvements | High | Medium |
| Continuing to make piecemeal improvements requiring multiple projects in the same location | High | Medium |
| Inability to align with local funding opportunities and coordination lead time to plan and deliver complex projects | High | Medium |
| Inability to increase opportunities to address safety in urban areas | Medium | Medium |
Risks related to urban pavements were scored highly by MnDOT staff. MnDOT districts have been struggling to complete these projects while addressing local needs and completing projects in rural areas. These projects are very expensive and can often be delayed due to lack of funding. The creation and funding of this category in MnSHIP will help reduce the highest risks related to partner coordination, ADA and multimodal needs in urban areas.
Other
Investment Priorities
MnDOT anticipates spending approximately 20.3% of its program on Small Programs and Project Delivery in all years of the plan (Figure 6-20).
Figure 6-20: Other Investment in MnSHIP
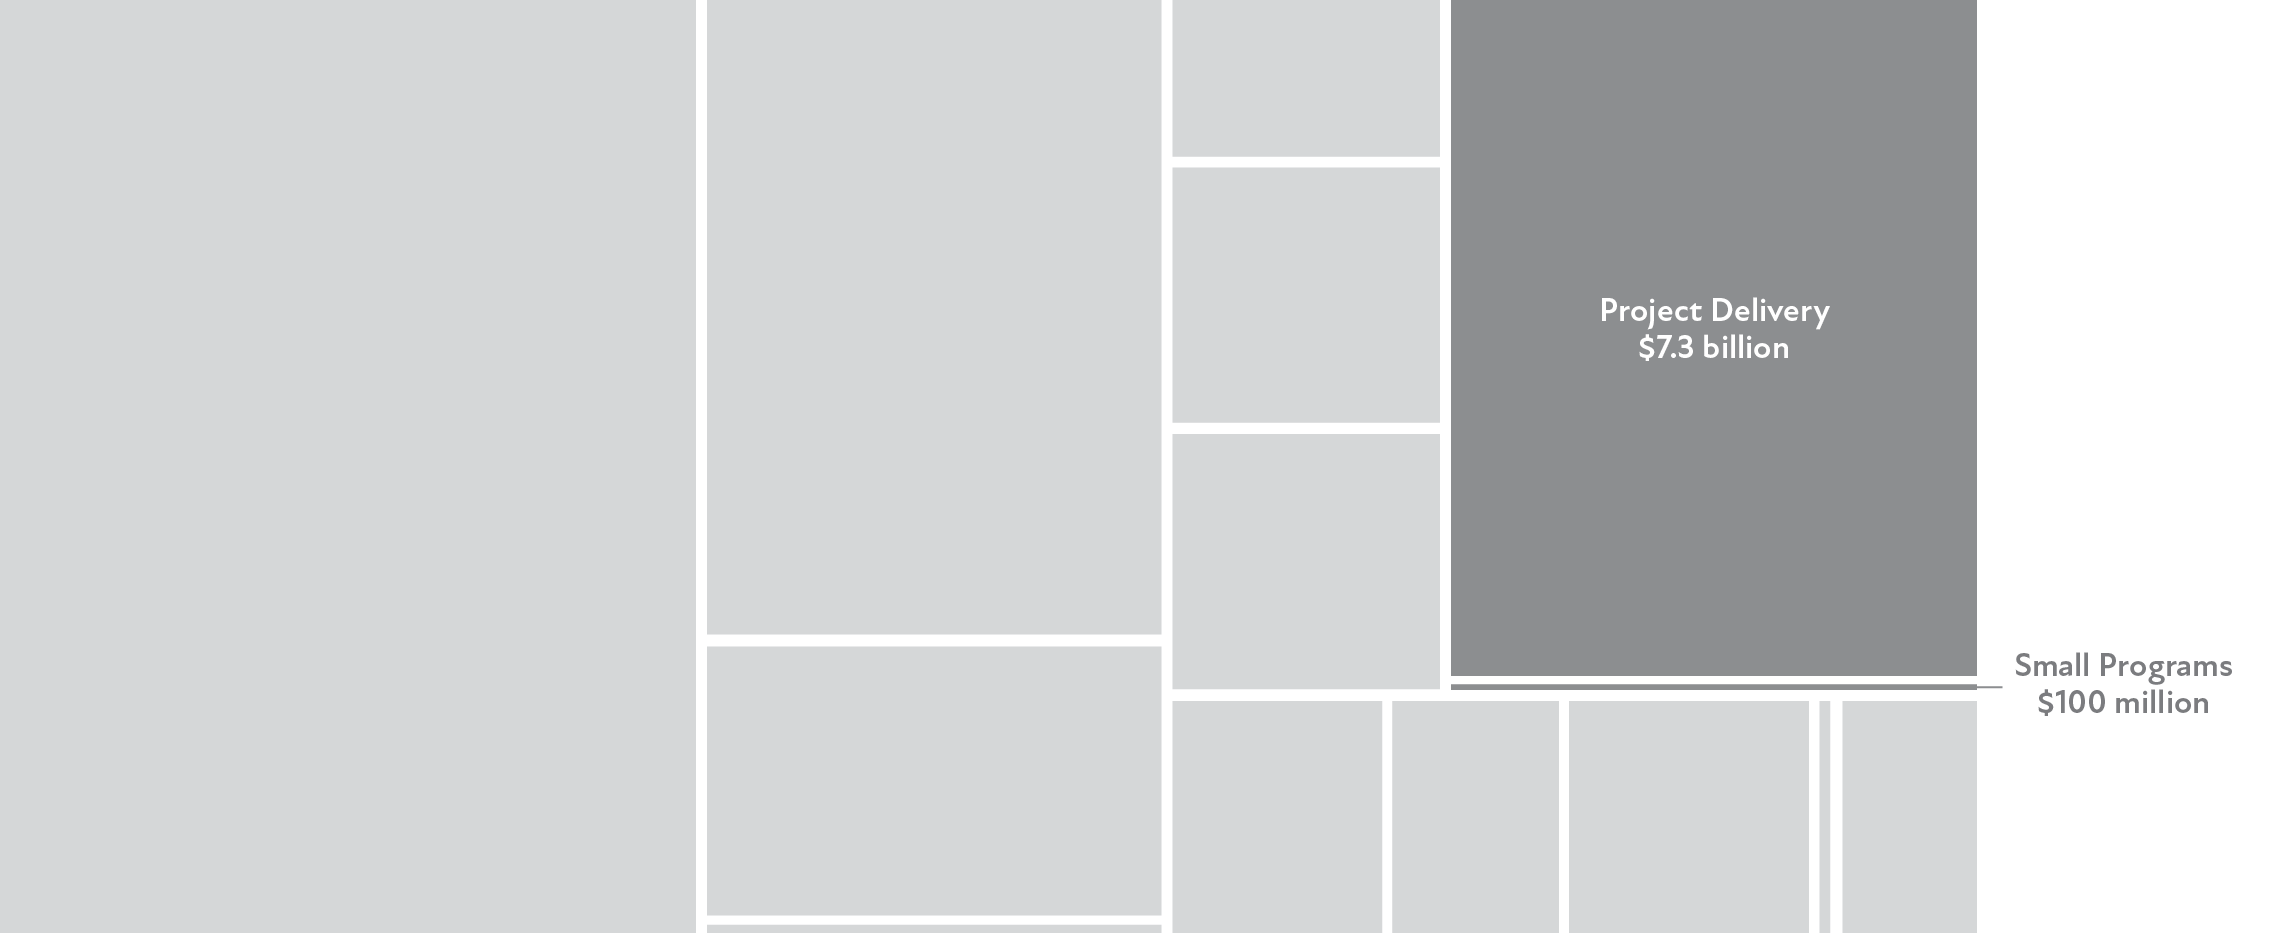
Project Delivery
Project Delivery includes components of projects that are critical to ensure the timely and efficient completion of highway projects. These components include right of way costs, consultant services, supplemental agreements and construction incentives (see Chapter 1: Plan Overview, for more detail on the components of Project Delivery). Historically, MnDOT has spent an average of 20% of total capital revenues on Project Delivery.
Project Selection
Investments in project delivery are the costs associated with delivering projects for the rest of the program. This category does not fund stand-alone projects.
Outcomes
MnDOT assumes that it will continue to spend approximately 20% of its funds in this category. This is consistent with recent averages for the MnDOT capital program.
Small Programs
Small Programs is used to fund short-term, unforeseen issues and one-time priorities/needs as they arise. Some programs do not easily fit into a MnSHIP investment category. If funding is required beyond the short-term, an effort is made to incorporate the program into a MnSHIP investment category during the next MnSHIP update. Small Programs in MnSHIP include funds for historic properties, flood and slide repair and cleaning up contaminated materials Project Selection
The project selection process for Small Programs varies depending on the program. However, projects are typically prioritized and selected centrally instead of at the district level.
Outcomes
MnDOT will invest $100 million in Small Programs through 2042.