
Chapter 5
Development of Investment Direction
MnDOT used various factors, including an extensive public engagement process, to develop priorities for investments on the state highway system over the next 20 years. This chapter describes the process MnDOT used to develop the investment direction, described in more detail in Chapter 6: Investment Direction. During this process, MnDOT considered many criteria, including:
- Federal and state requirements
- MnDOT policy goals and objectives
- Technical information on the condition of the state highway system
- Investment needed to maintain the system in a state of good repair
- Estimated revenue over the 20 years of the plan
- Management of key risks to the system
- Public and stakeholder input
The process helped MnDOT complete several key tasks, including communicating future outcomes for the state highway system and gauging the degree to which different investment approaches align with public, stakeholder and agency expectations.
Development of Investment Approaches
MnDOT identified investment needs up to $57 billion over the next 20 years (Chapter 4: Investment Needs) and projects to have $36.7 billion in revenue (Chapter 3: Revenue Outlook). Given that investment needs exceeded available revenue, trade-off decisions are necessary to balance numerous competing priorities. To illustrate these trade-off decisions, MnDOT developed performance levels for each investment category. These performance levels were the basis for an online budget tool and the six investment approaches used for public outreach.
Development of Performance levels
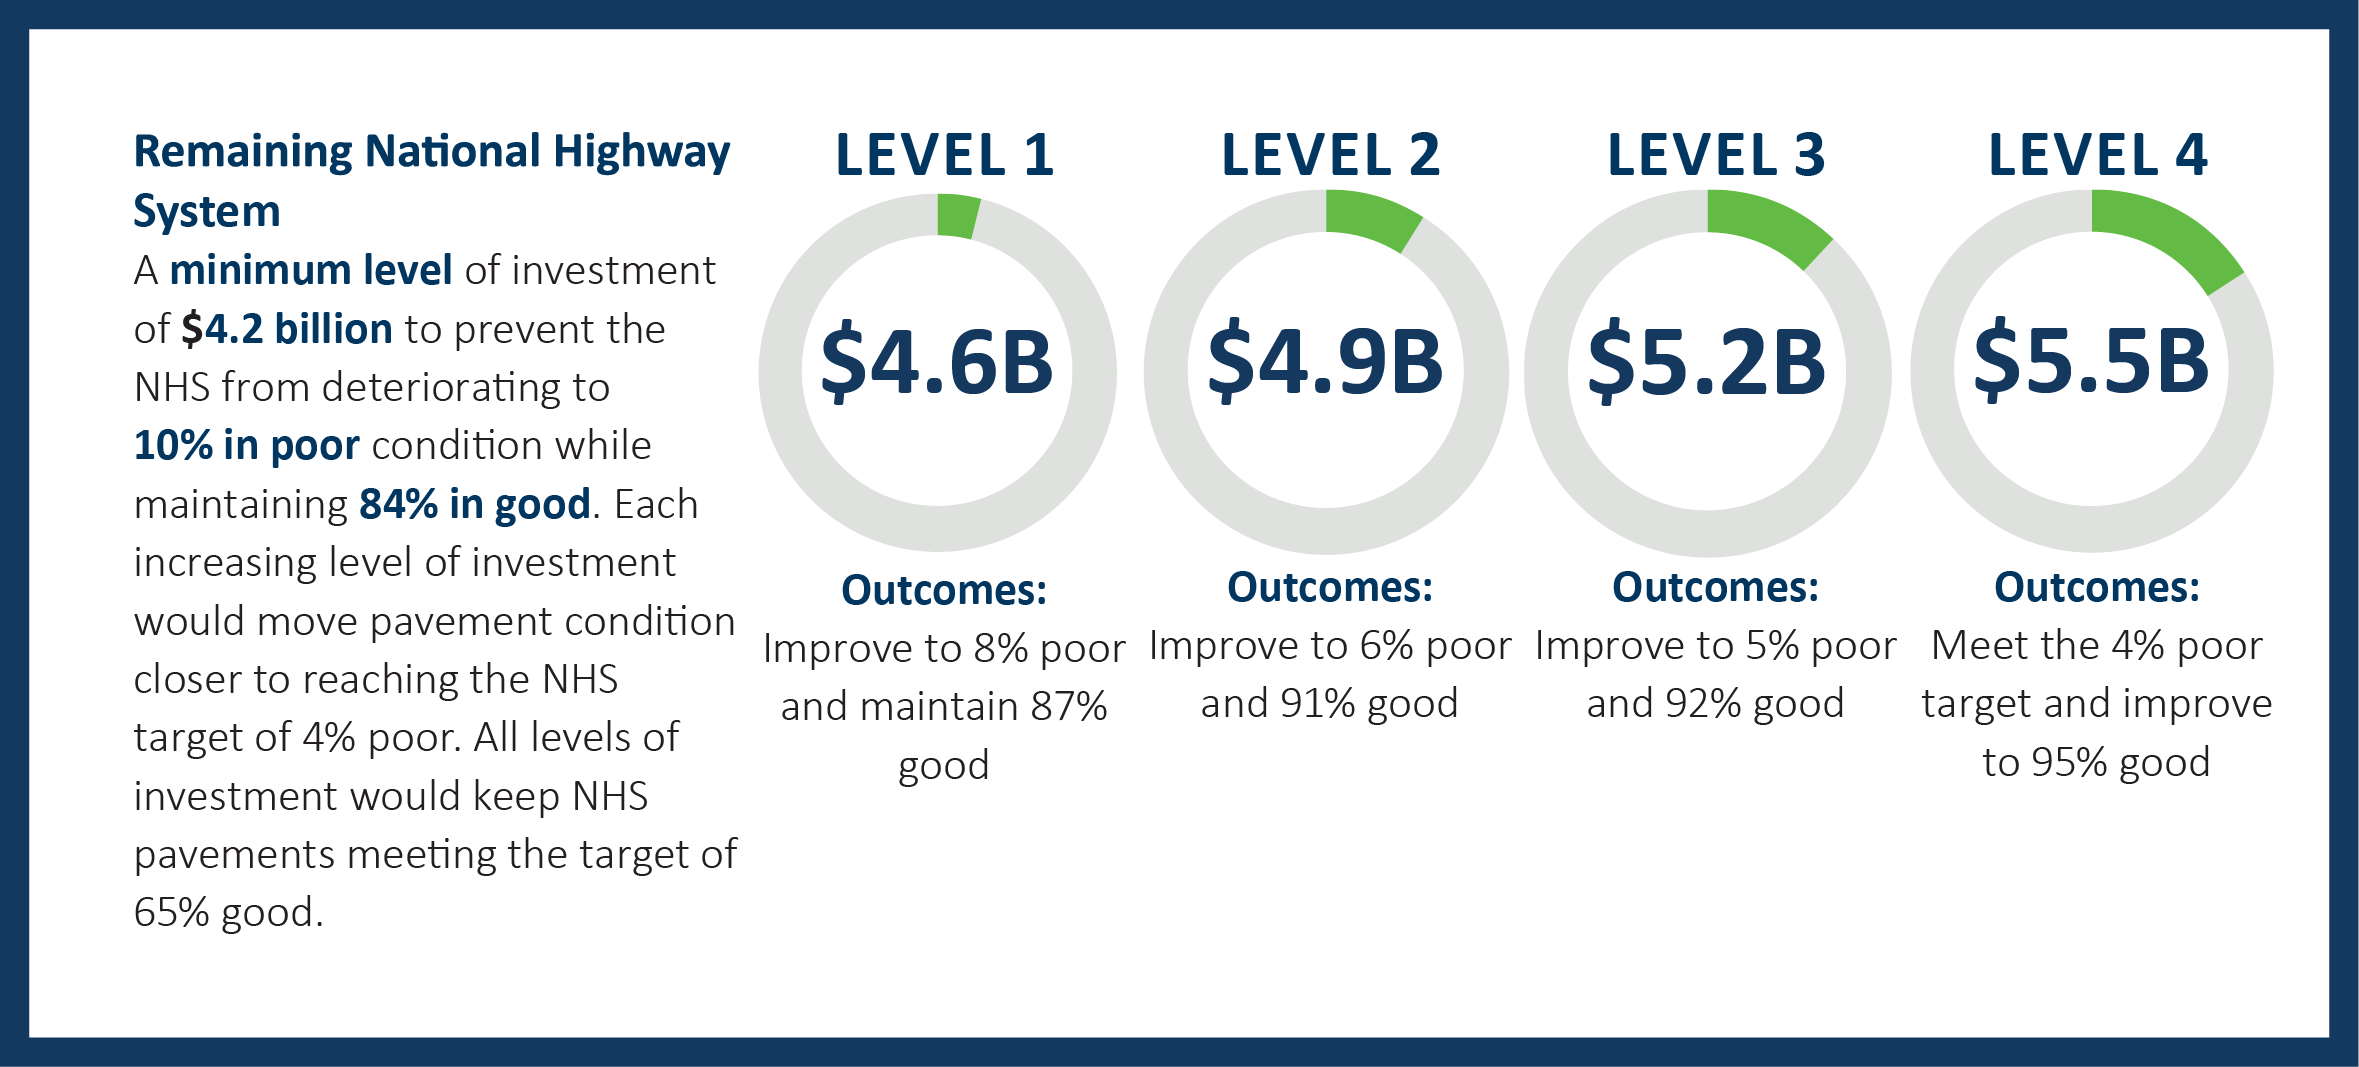
During 2021, MnDOT formed workgroups for each investment category. These workgroups, composed of planning and engineering staff from MnDOT as well as staff from other agencies, assisted in creating performance levels. Performance levels represent an investment amount for each investment category to reach specific outcomes identified by the workgroup. Each category had three to five performance levels (Performance Level 0 to Performance Level 2, 3 or 4). MnDOT used both performance measures and risk to define a potential range of investment in each category. The lowest performance level, PL0, represents the minimum level of investment that is acceptable given MnDOT’s responsibility for public safety and basic system functionality. The highest investment levels allow MnDOT to meet the goals and objectives for each investment category and to make more progress toward the Minnesota GO Vision. Each performance level corresponds with a different set of improvements, outcomes and risks (Figure 5-1). The Investment Category Folios provide more information on how performance levels were developed.
Figure 5-1: Excerpt from the Pavement Condition Investment Category Folio
Conversion of Performance Levels into Investment Approaches
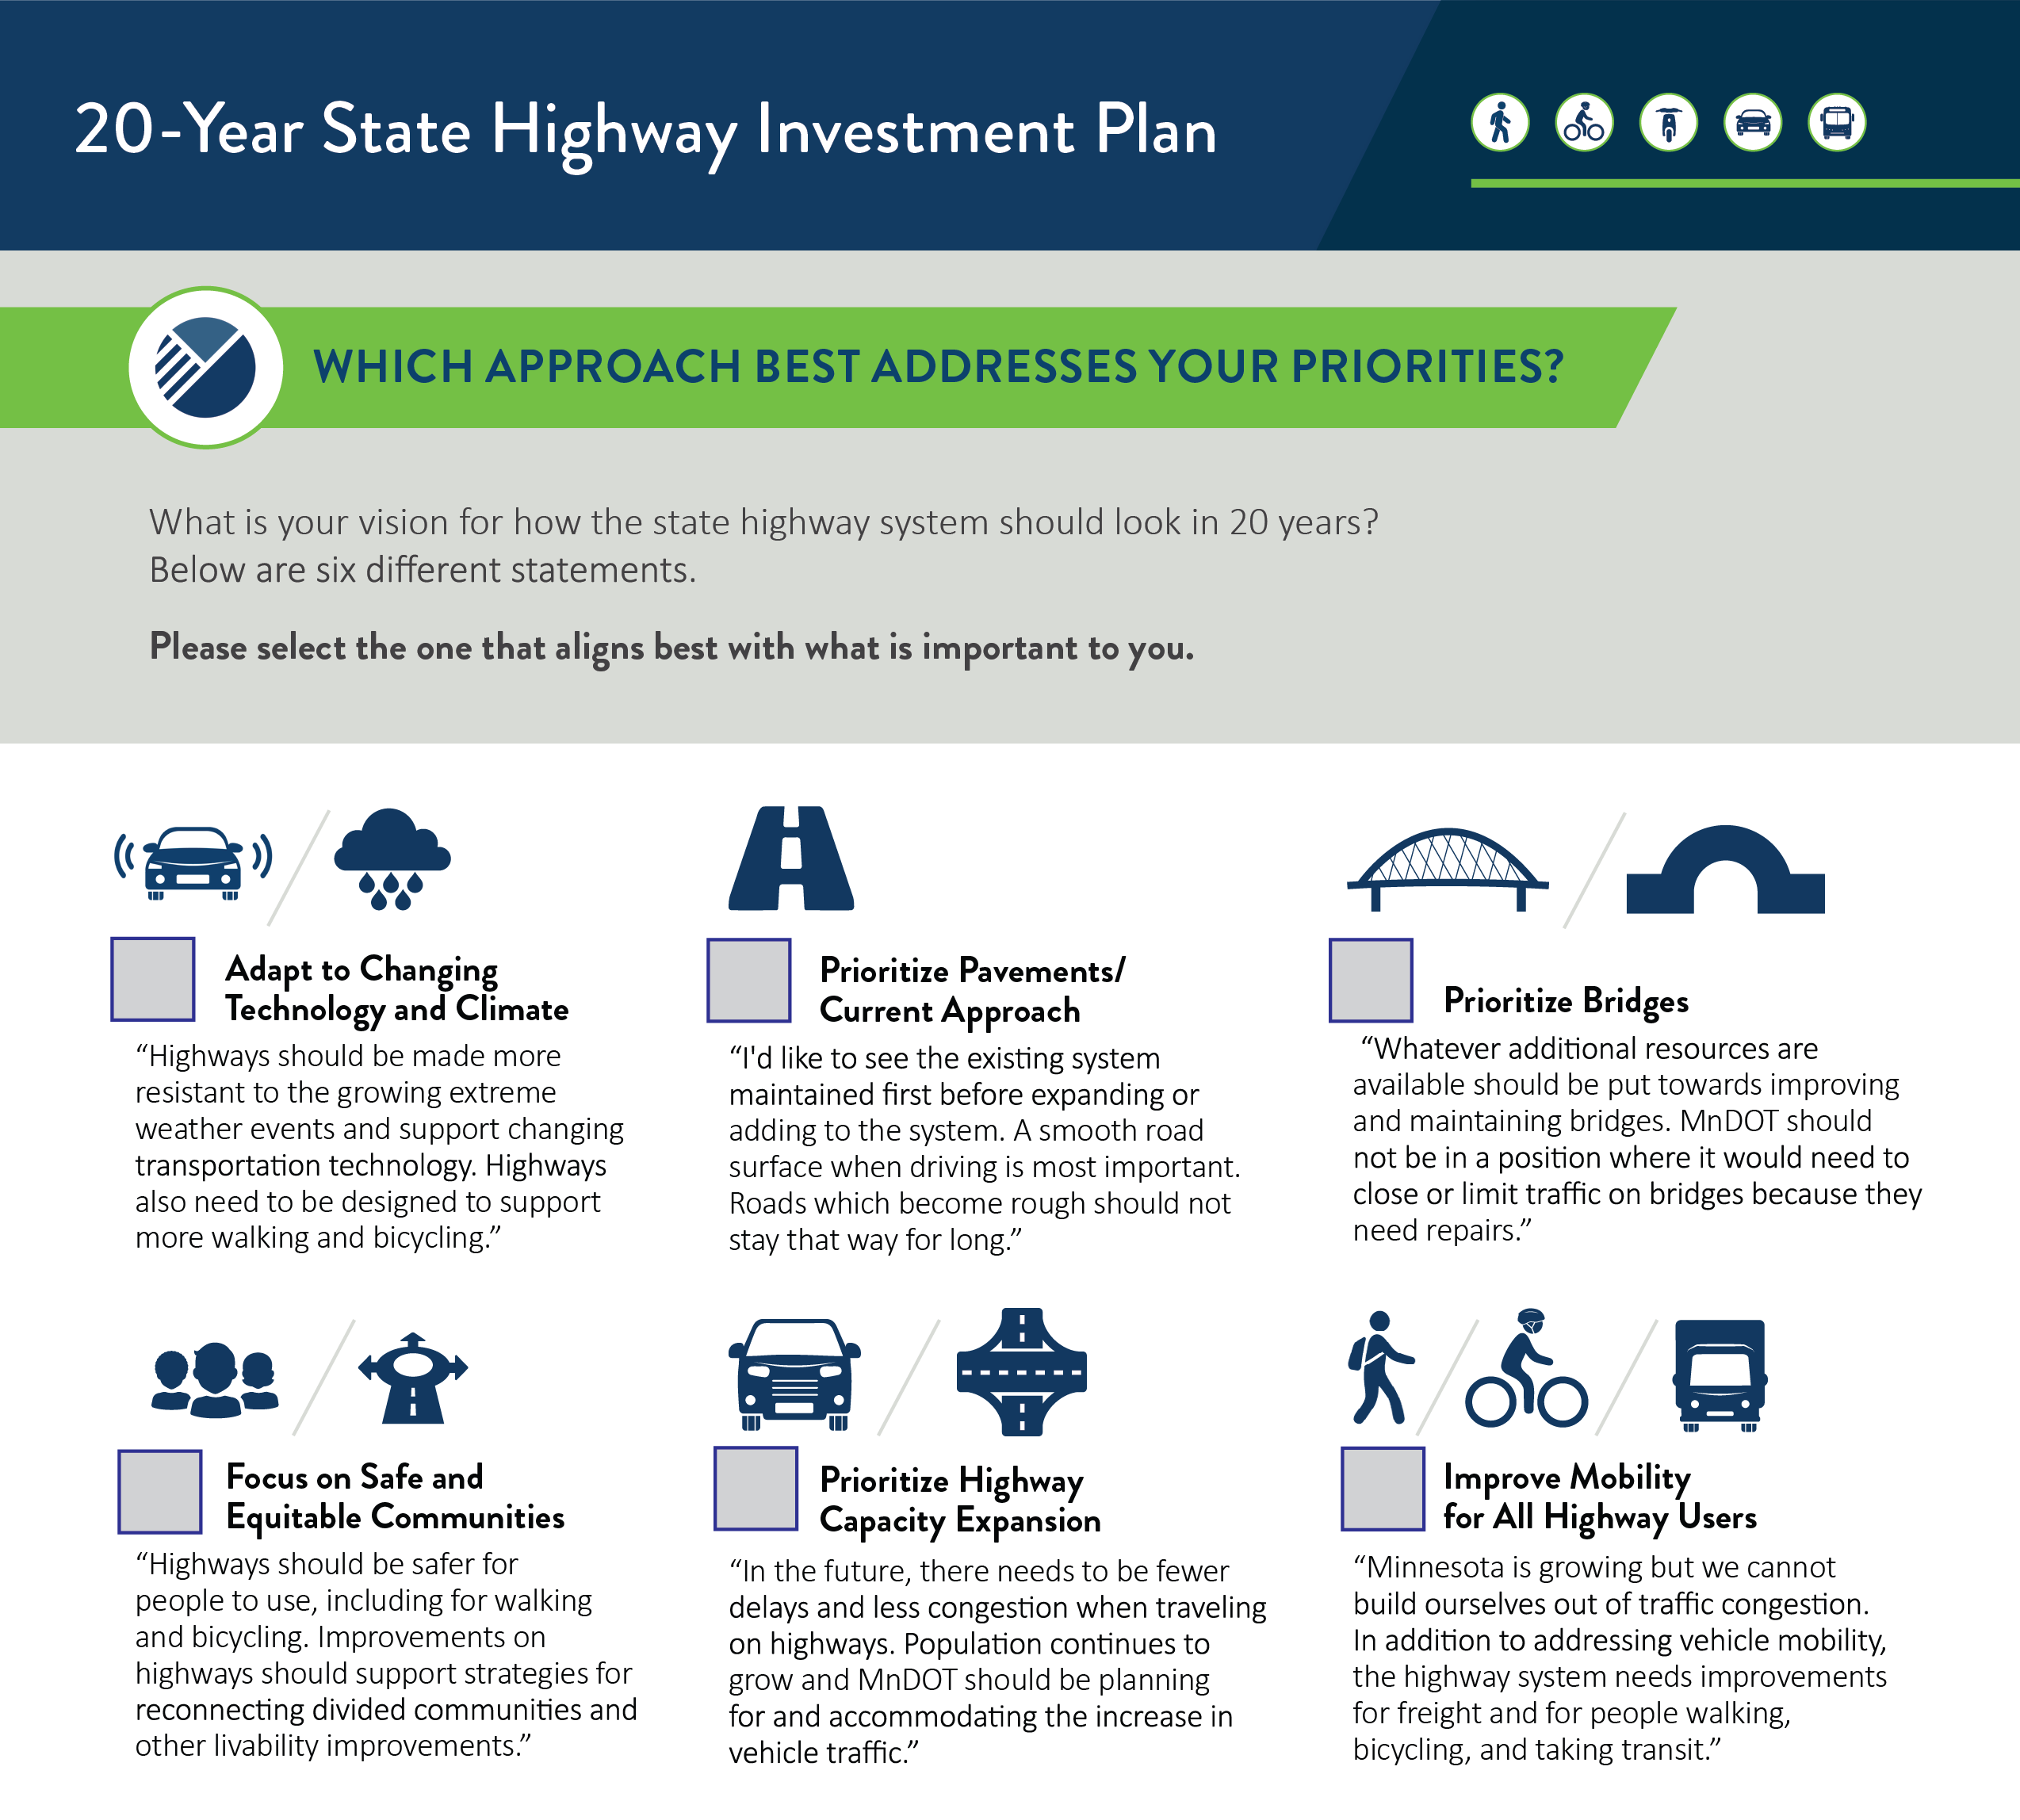
MnDOT packaged different combinations of performance levels for each of the investment categories into six fiscally-constrained investment approaches as shown in Figure 5-2. These approaches were developed and named to highlight different potential focus areas of investments. At in-person events, MnDOT staff used the approaches with qualitative statements as part of paper surveys as shown in Figure 5-3.
Figure 5-2: Investment Approaches Developed for Public Outreach
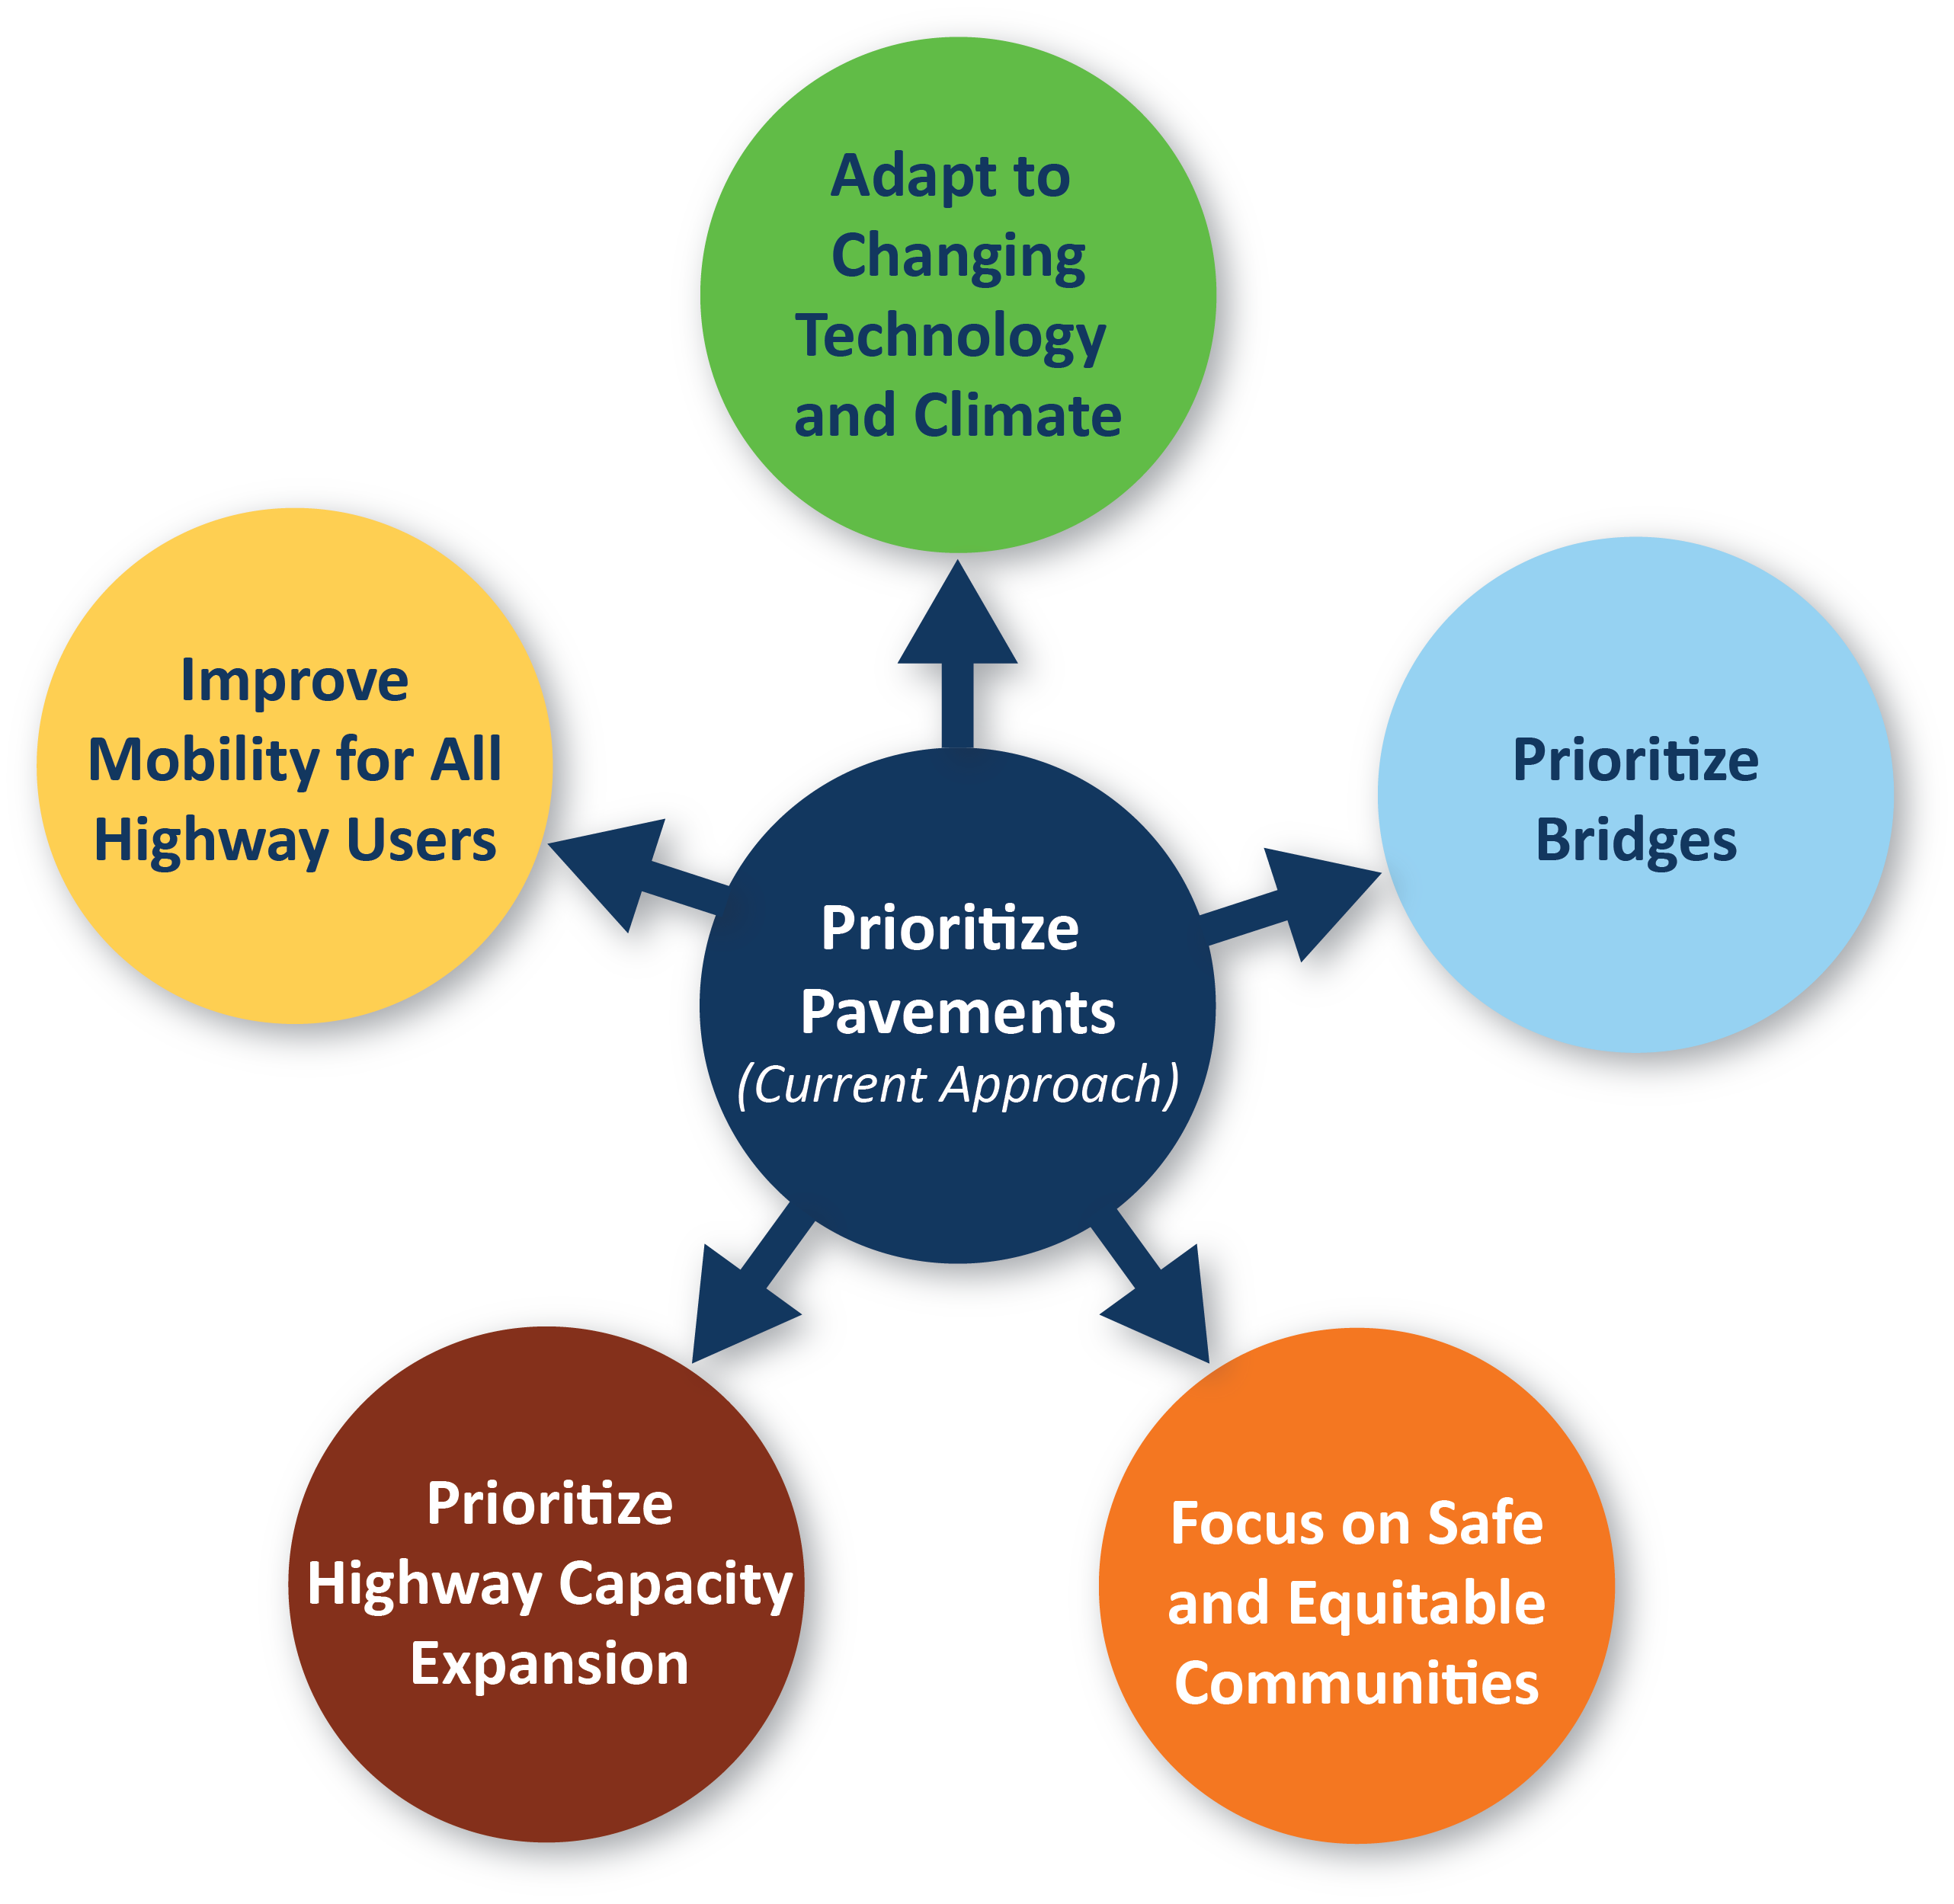
Figure 5-3: Public Outreach Questionnaire Example
Each approach used the same baseline assumptions:
- $31.5 billion in revenue is available over the next 20 years (2023-2042).
- Each investment category must be funded to at least the lowest performance level.
- The Project Delivery investment category requires a constant amount of funding to deliver the program based on historical spending patterns.
- MnDOT will meet Americans with Disabilities Act substantial compliance standards for pedestrian infrastructure by 2037.
- MnDOT needs to meet federal and state legislative requirements.
MnDOT used these approaches to show how available funding could be divided among the investment categories over the next 20 years based on different priorities. This demonstrates a range of possible investments and outcomes.
In addition to the investment approaches, MnDOT used the performance levels in an online investment tool for the public to build their own state highway budget. The public engagement process is described in more detail in the following section.
Public Engagement Summary
The plan update process included several engagement phases. The focus of engagement was different in each phase. Engagement Phase 1 (July to September 2022) focused on different investment scenarios. MnDOT asked participants to identify which scenario they preferred and which investment categories are most important. Members of the public could also build their own investment scenario using an online budget tool. Engagement Phase 2 (March to May 2023) focused on getting feedback on the draft investment direction. MnDOT asked participants to review and comment on the draft investment direction, identify what they like or would change, and prioritize investments if additional funding was available.
The overall process used innovative strategies for in-person engagement, online engagement and engagement of traditionally underserved communities. MnDOT expanded its use of public engagement techniques from the 2017 plan including piloting a new web-based budget tool to gather input from transportation partners, stakeholders and the public on priorities for investment. This feedback helped MnDOT identify priorities for developing the 20-year investment direction.
The overall goals for public engagement for the MnSHIP plan were to:
- Create meaningful, equitable and safe opportunities for public involvement early and often, including a range of engagement opportunities, both in-person and online, that reduce barriers to participation.
- Use innovative engagement methods to reach more individuals statewide and pilot new tools to reach underrepresented communities in statewide planning engagement efforts.
- Offer a variety of platforms to provide input, including online and in-person engagement opportunities.
- Understand priorities from transportation partners, stakeholders, underrepresented communities and the public for investing on the state highway system.
MnDOT tracked demographics as part of this outreach effort. All engagement tools that were completed anonymously asked participants to identify their zip code, age, gender and race/ethnicity. Answering these questions was optional and voluntary. The project team collected and analyzed the data throughout the engagement effort to determine if certain populations were missed. The data helped refine the engagement strategy from month-to-month to address any shortfalls. After analyzing the data, MnDOT adjusted the engagement focus to increase the participation from traditionally underserved communities through targeted Facebook ads and a partnership with community-based organizations. The intended outcome was to reach a population that is representative of Minnesota’s demographic makeup.
Engagement Overview
In-Person Engagement
MnDOT conducted in-person engagement to get feedback from a variety of participants, including transportation partners, stakeholders, underrepresented communities and the public.
- Stakeholder meetings informed partner agencies, government organizations and other stakeholder groups about the project so they could advise on plan elements and the overall project direction.
- MnDOT attended community events to collect survey results and share project information via poster boards and handouts. Events were selected to cover a range of locations and a diverse group of Minnesotans.
Community-Based Engagement
MnDOT partnered with four community-based organizations to extend engagement to populations and locations where these groups had greater reach. MnDOT also used the following engagement tools and techniques to reach traditionally underserved populations.
- Tribal Outreach
- Facebook Targeted Ads
- University Student Groups Outreach
Online Engagement
MnDOT developed an interactive budgeting tool that allowed viewers to make budgeting decisions and trade-offs. Respondents expressed investment priorities in the context of the MnSHIP budget. The tool included an option to start from an initial investment direction or create your own budget based on the ranges available and included optional demographic questions. The budget tool was shared through social media, project website, stakeholder engagement and community events.
The survey that was used at in-person events was also available online. The online survey was distributed through partner and stakeholder online and social media networks and was translated into Spanish, Hmong and Somali. During Phase 1, the survey asked participants to identify their preferred approach among six potential investment approaches.
A full public outreach summary is available in Appendix B: Public Engagement Summary.
Phase 1 Engagement Results
Budget Tool
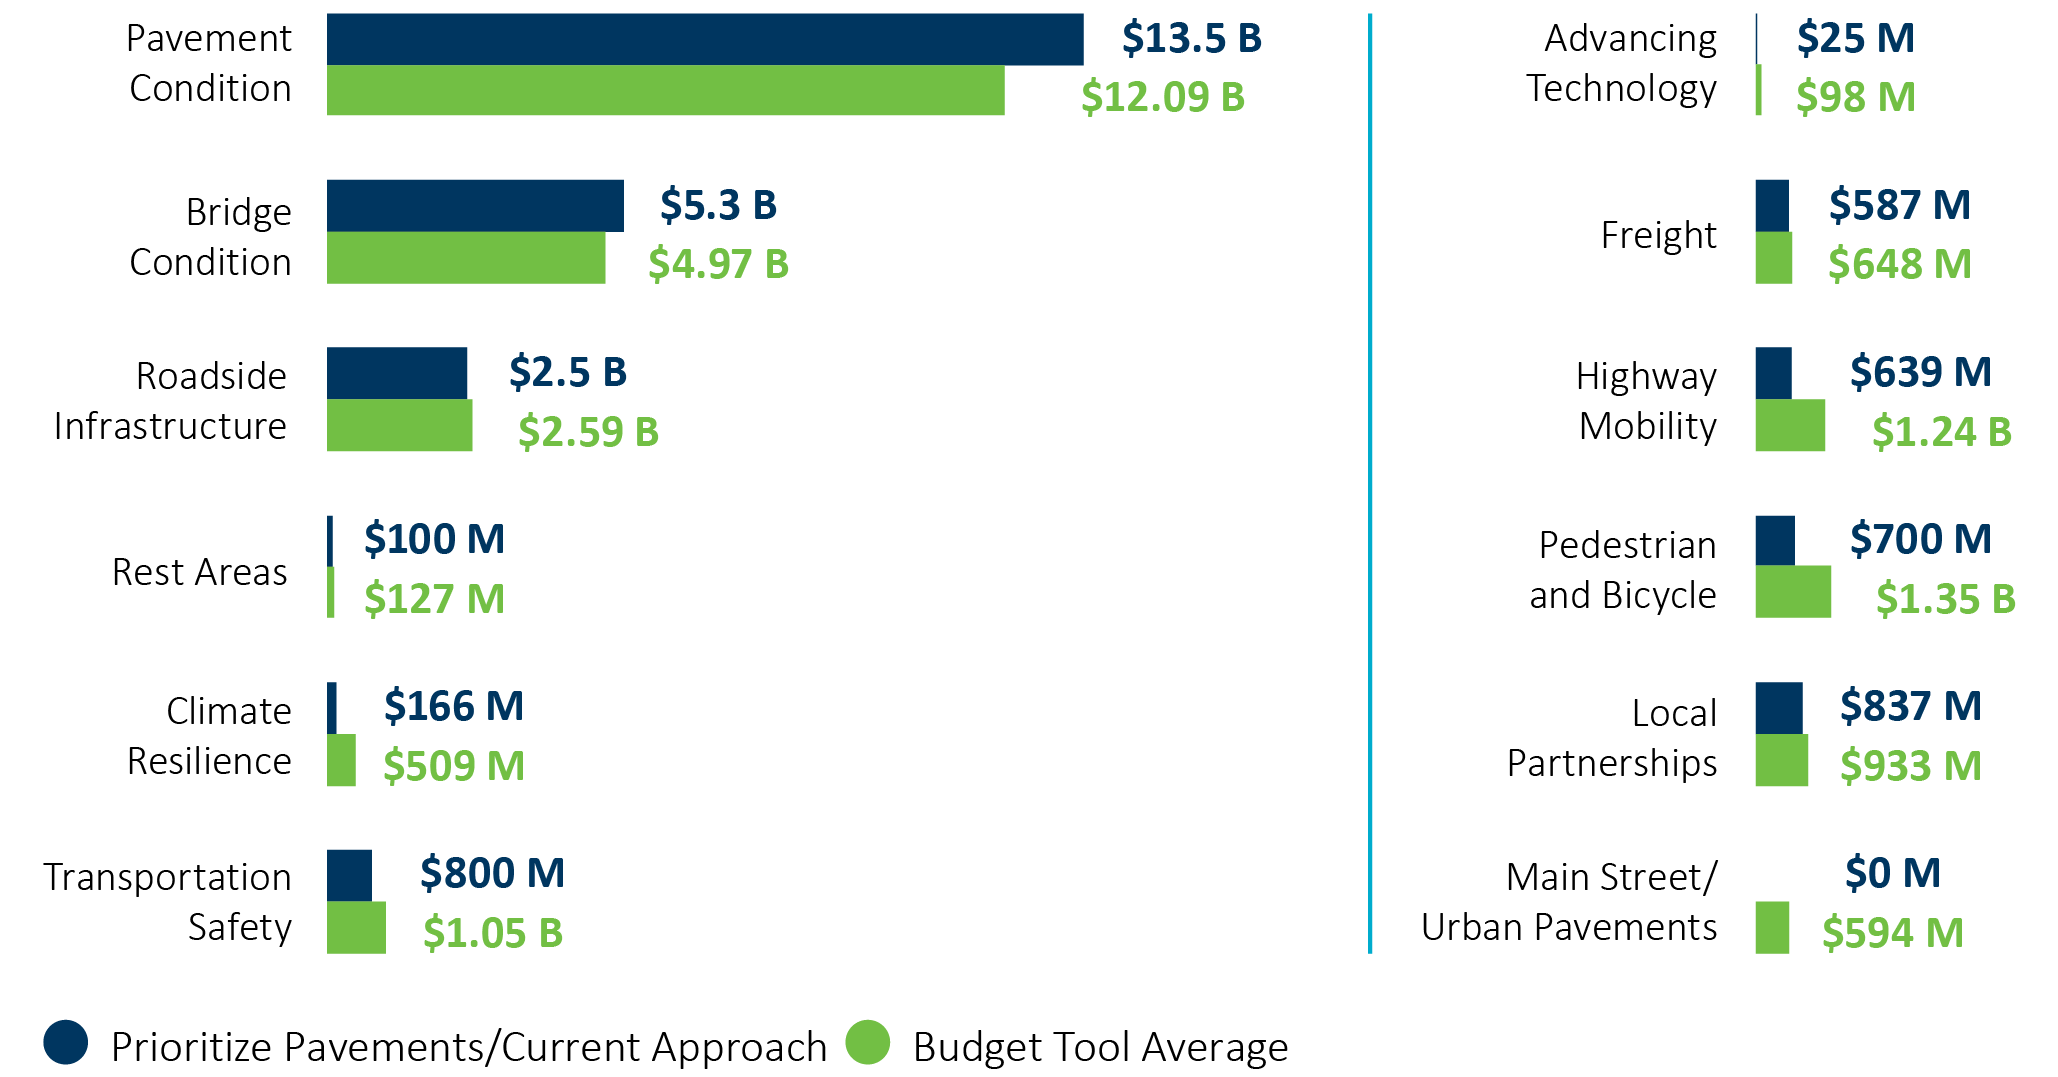
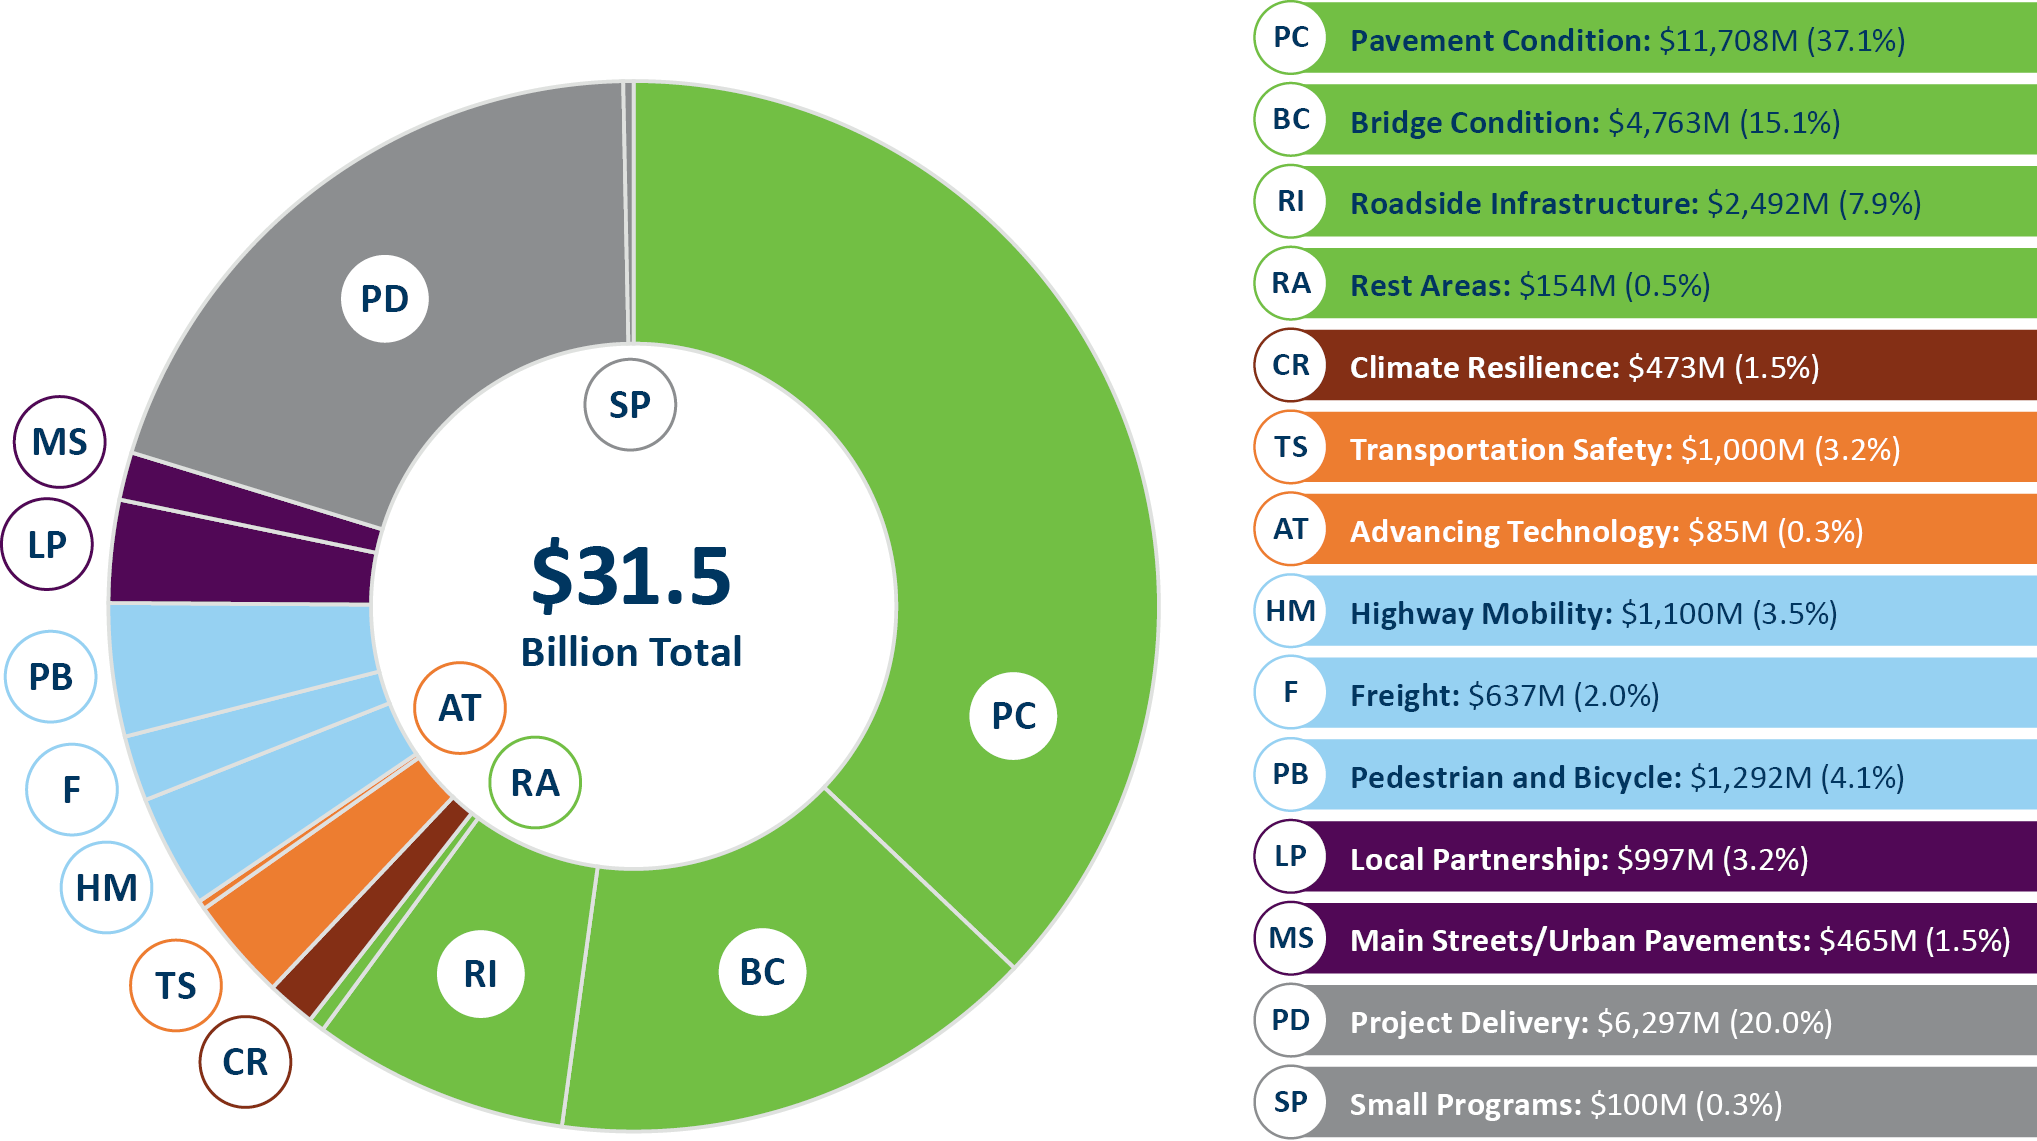
More than 1,000 people selected investment priorities in the online budget tool. On average, these people prioritized more funding towards Climate Resilience, Transportation Safety, Advancing Technology, Highway Mobility, Pedestrian and Bicycle and Main Streets/Urban Pavements than the current approach. People also selected less funding to Pavement Condition on average than the “Prioritize Pavement/Current Approach” scenario.
Figure 5-4: Online Budget Tool Funding Results
Survey
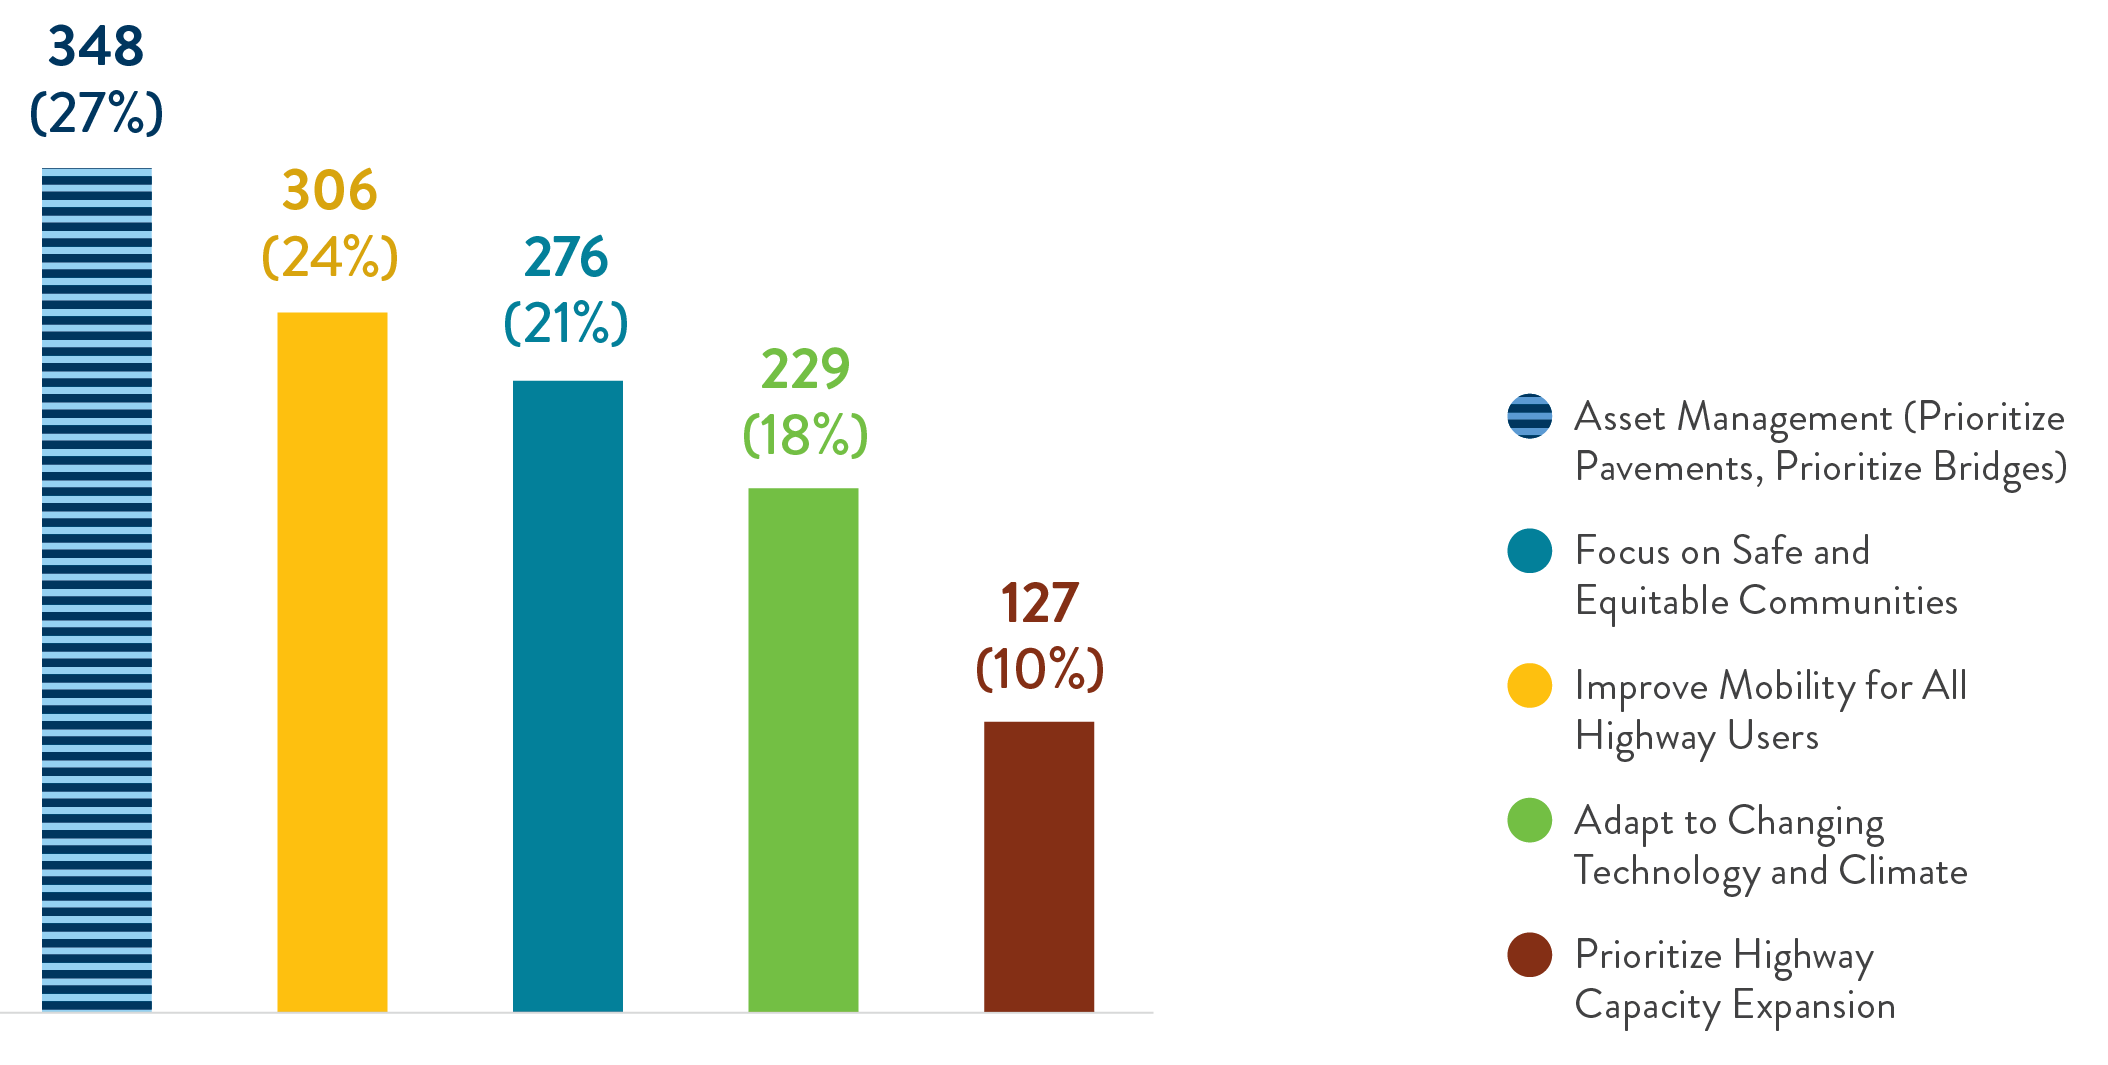
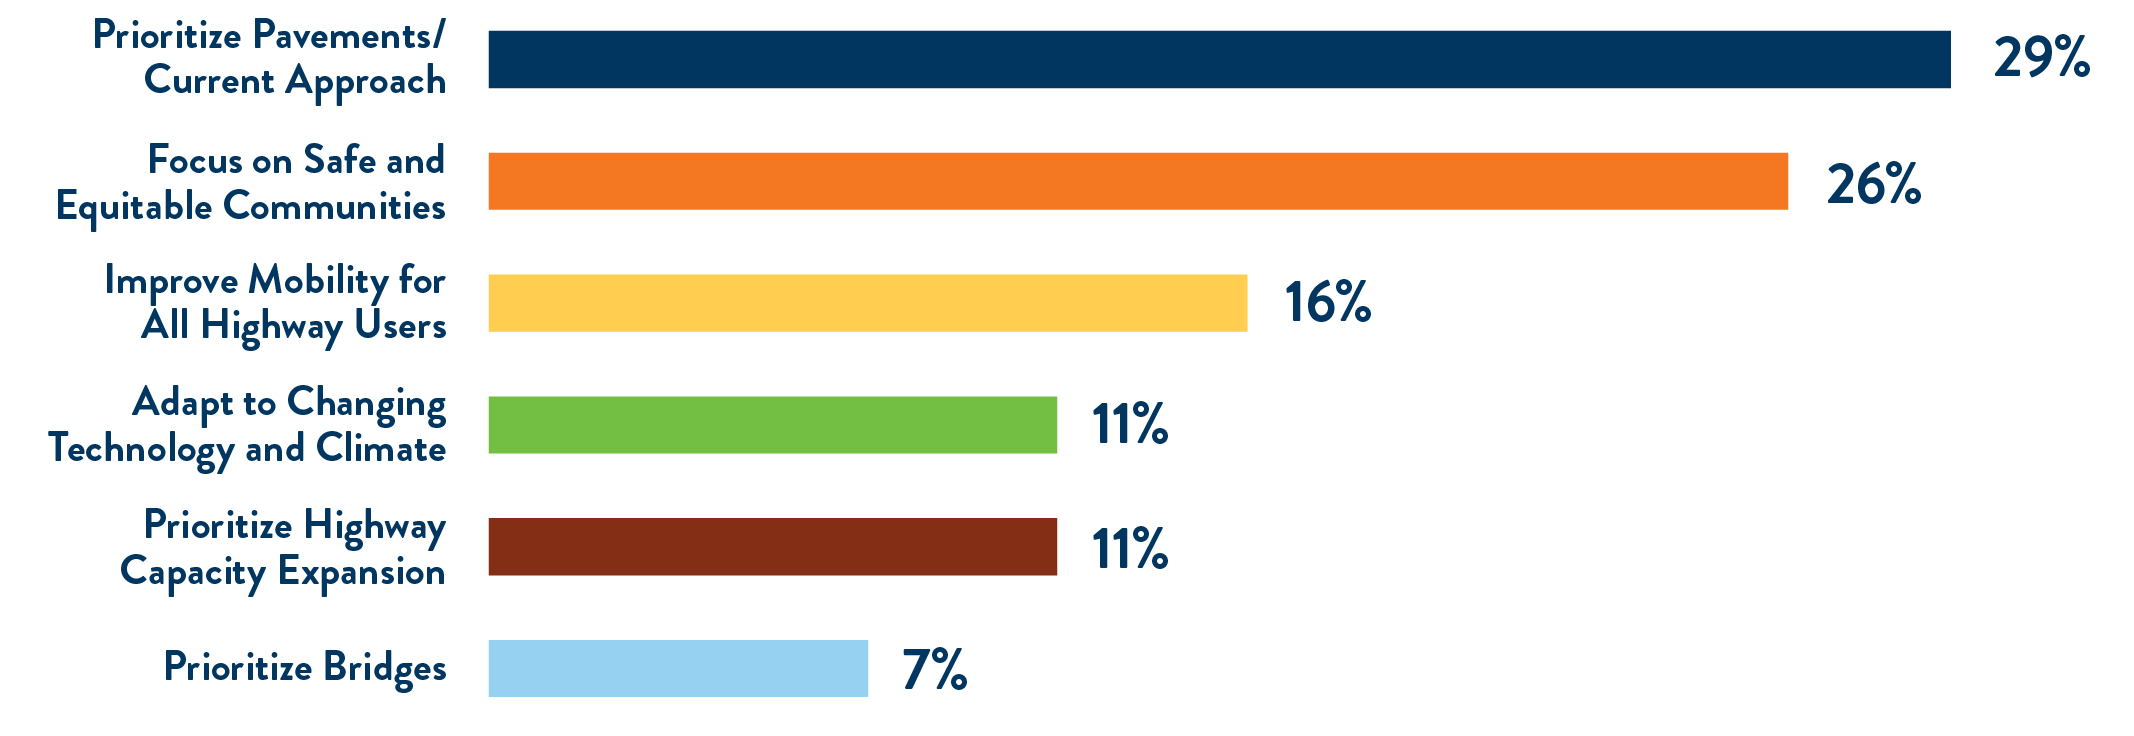
Almost 1,000 people filled out the MnSHIP survey to select a preferred investment approach. The most selected preferred approach was Improve Mobility for All Highway Users. However, no approach received a majority. Three other approaches were selected around 20% of the time. The current approach received the third most selections at 20%. Between the Prioritize Bridge and Prioritize Pavement approach, 27% of participants selected an approach which prioritizes maintaining the system over other approaches.
Figure 5-5: Preferred investment approach
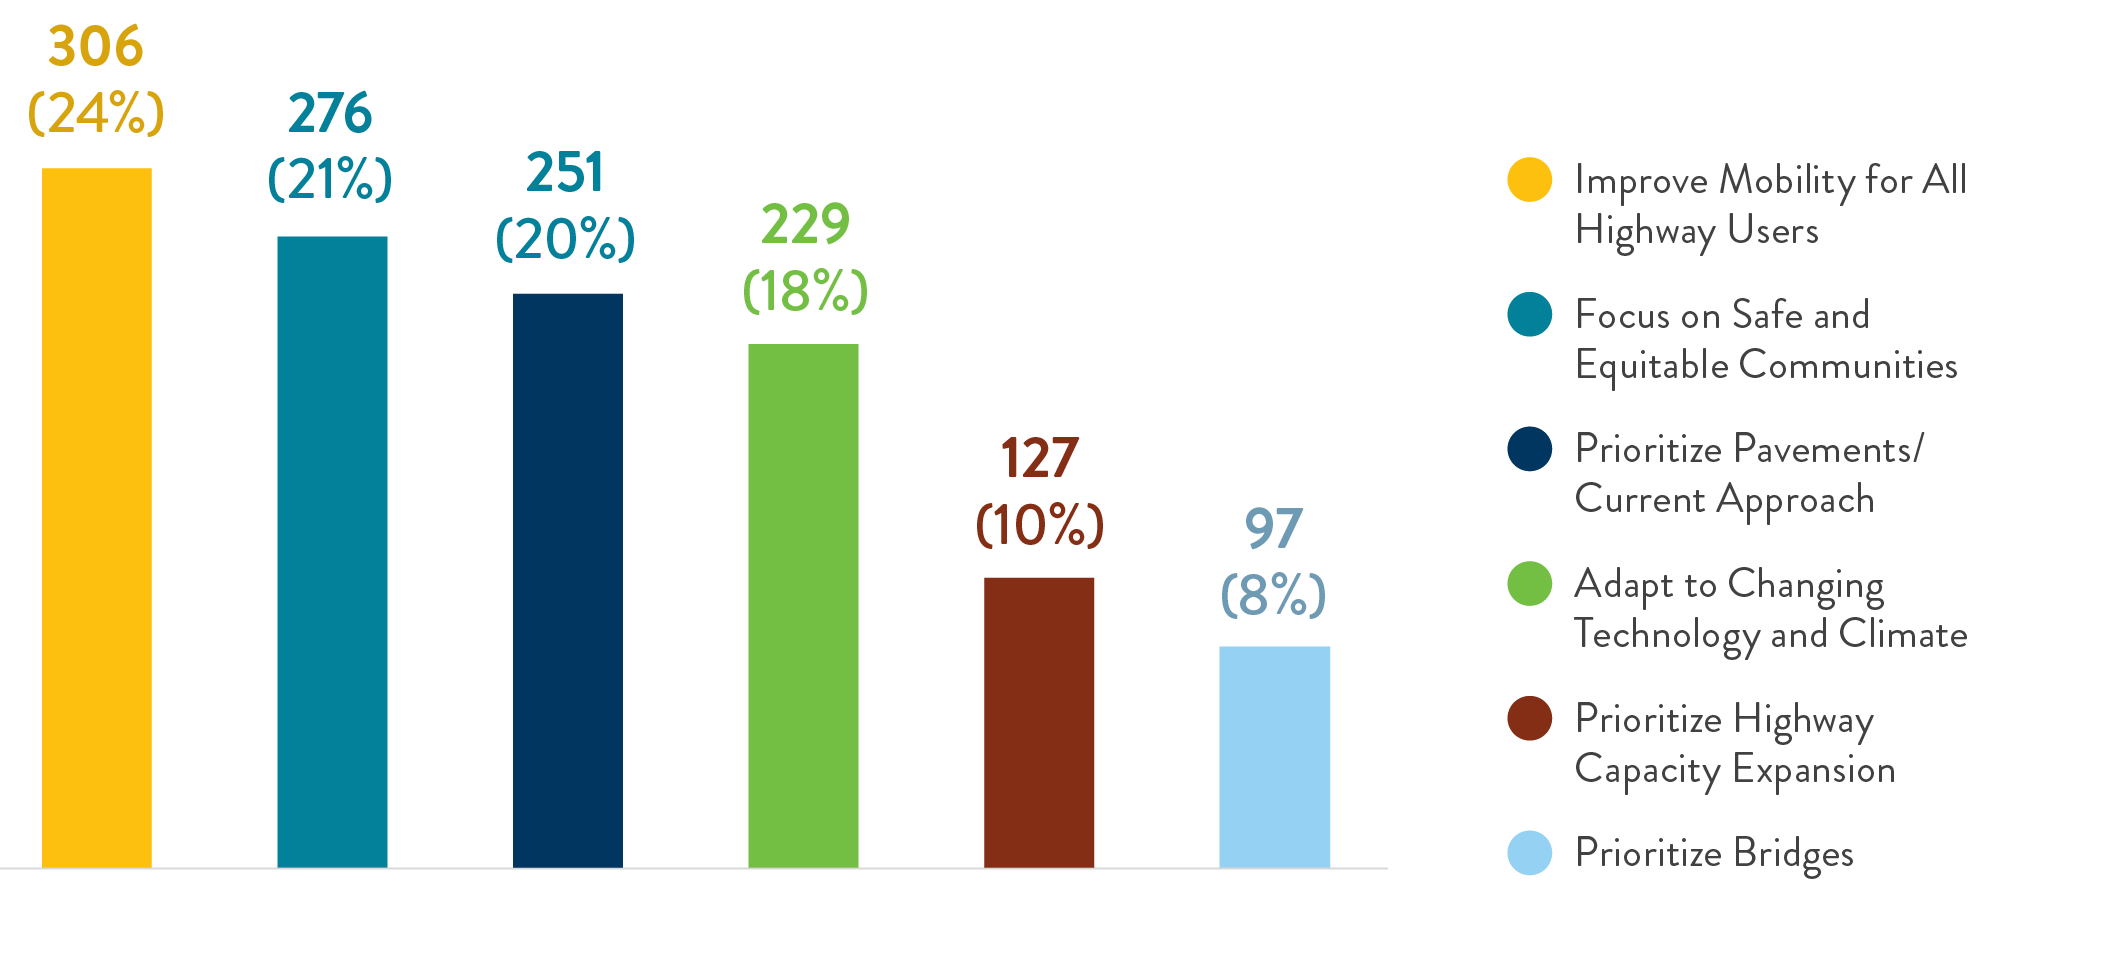
Figure 5-6: Preferred Investment Approaches with Combined Asset Management Responses
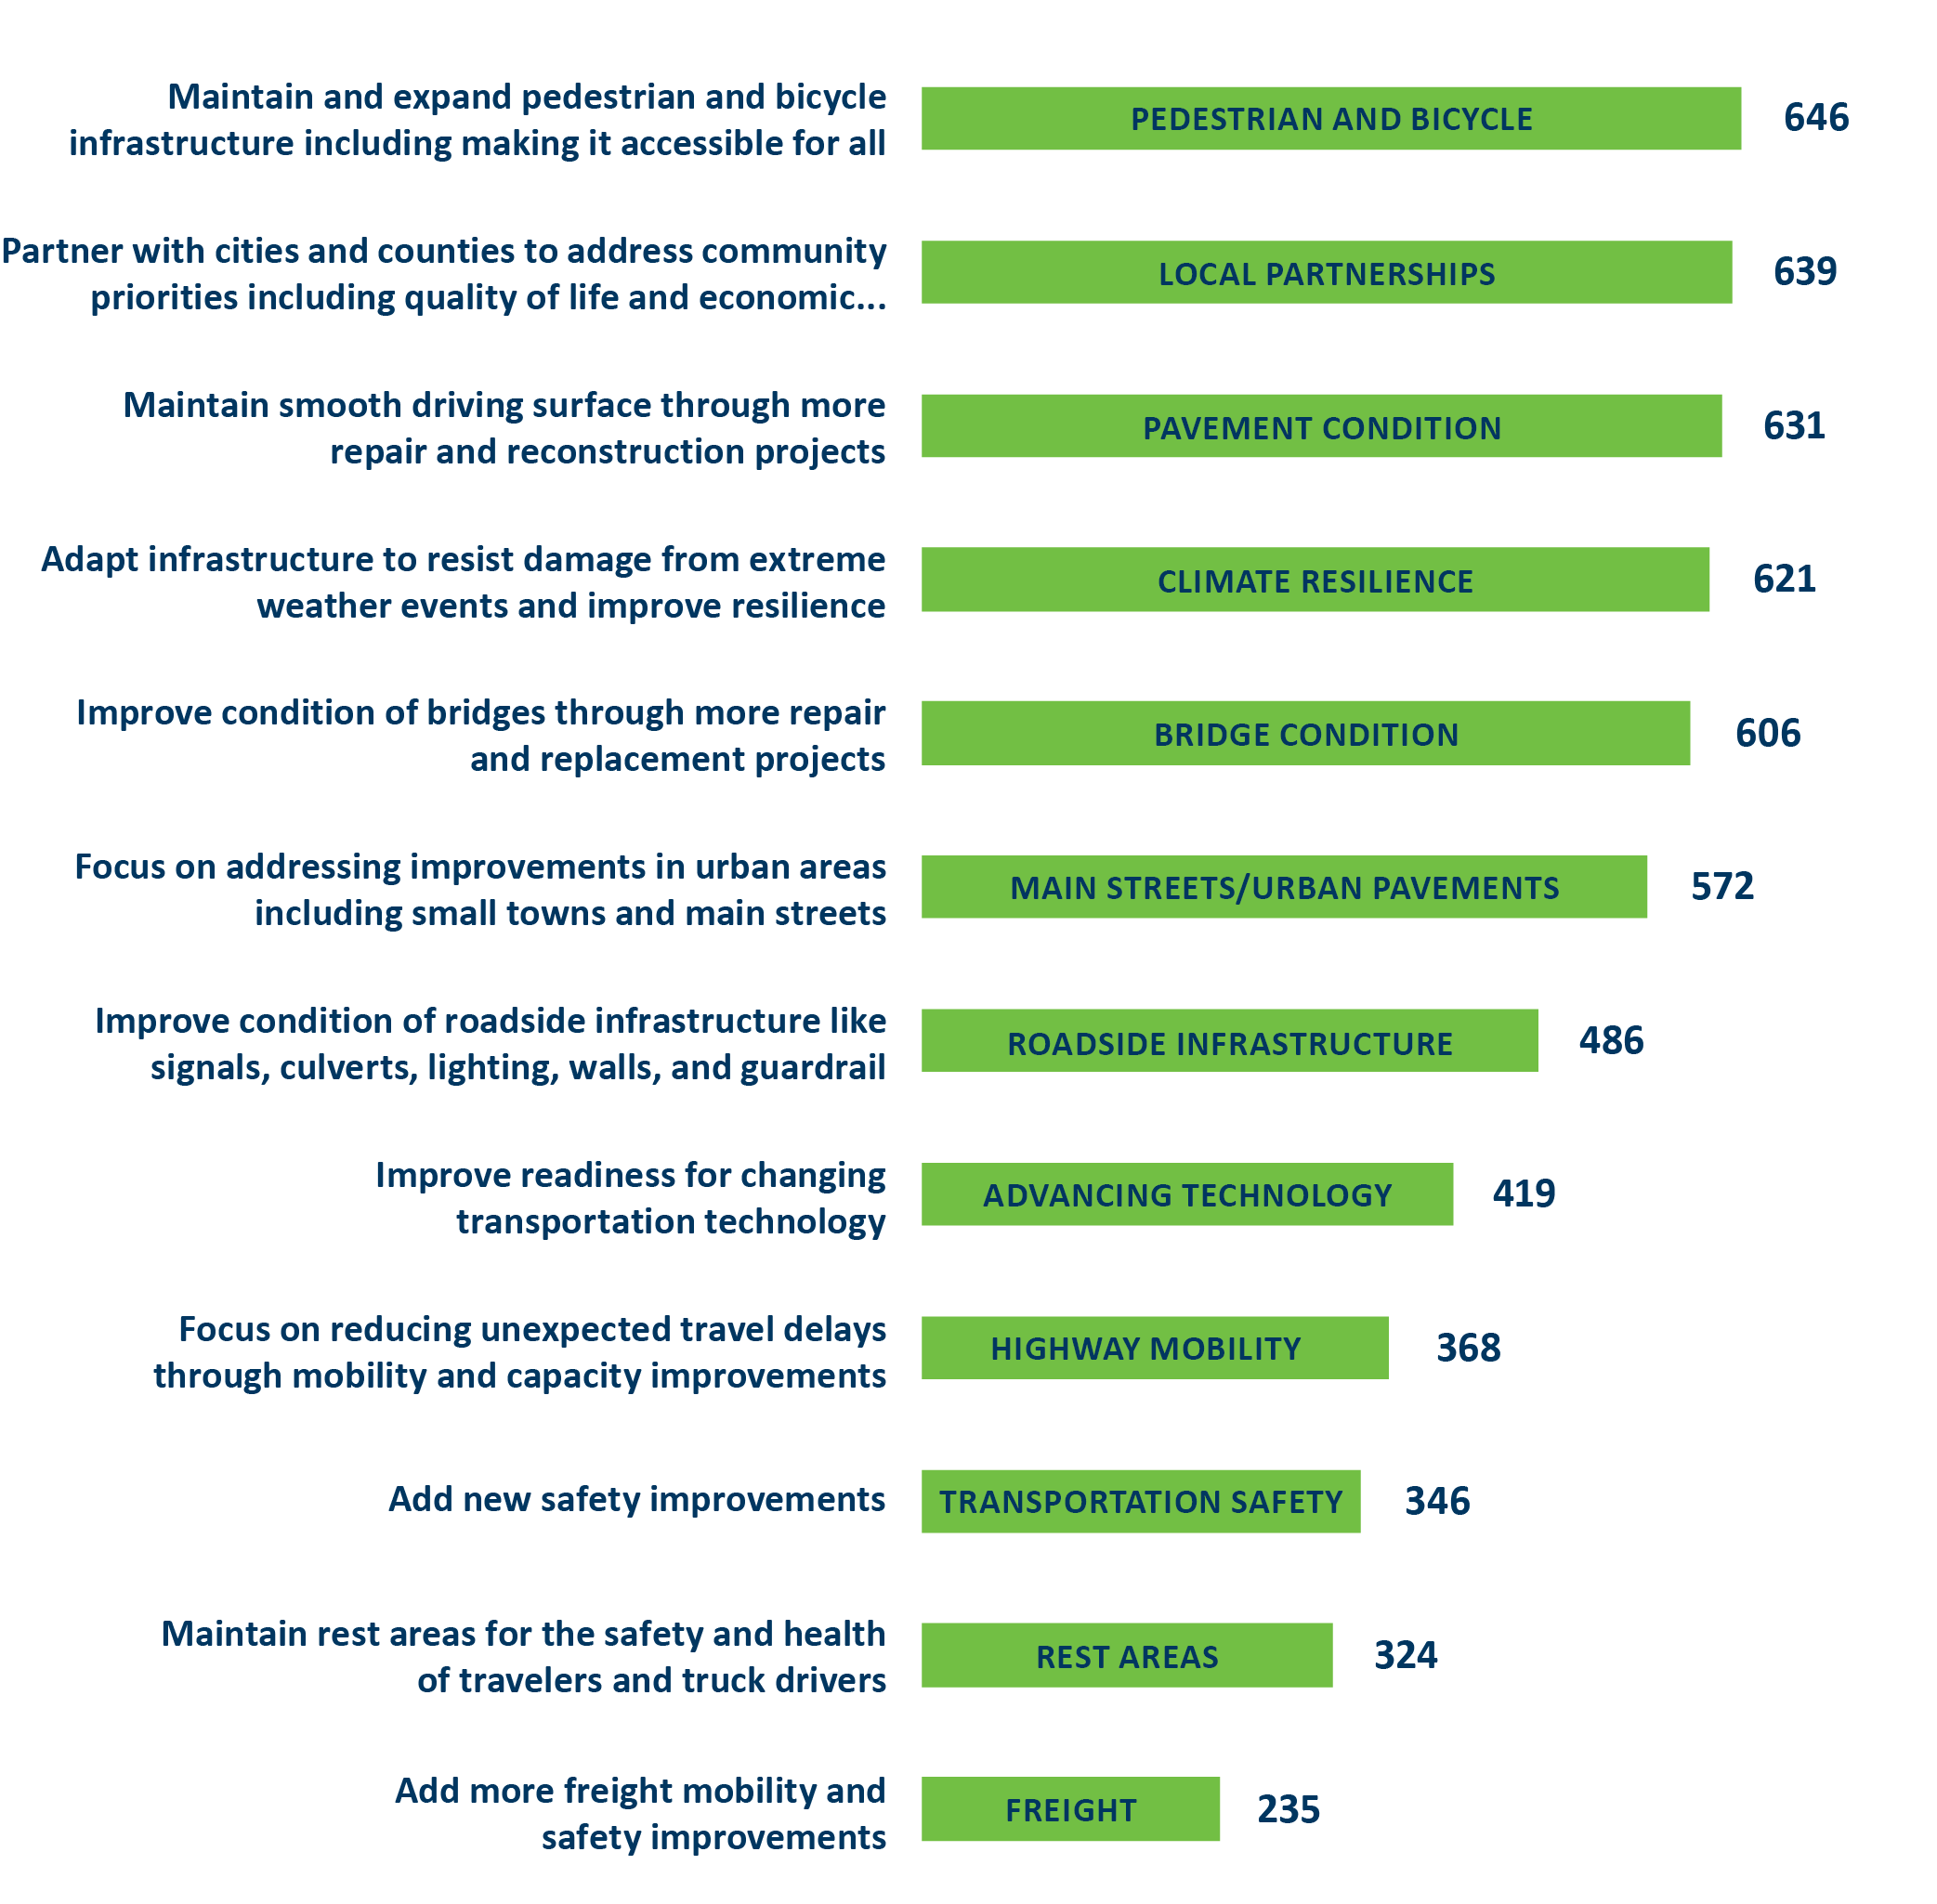
The short surveys asked respondents to select their top five priorities for state highway investment from a list of 12 investment categories. The plain language investment category language is shown on the left in Figure 5-7. The MnSHIP Investment Category name is shown on the right along with the number of survey responses.
Figure 5-7: Top Improvements Selected from Survey Results
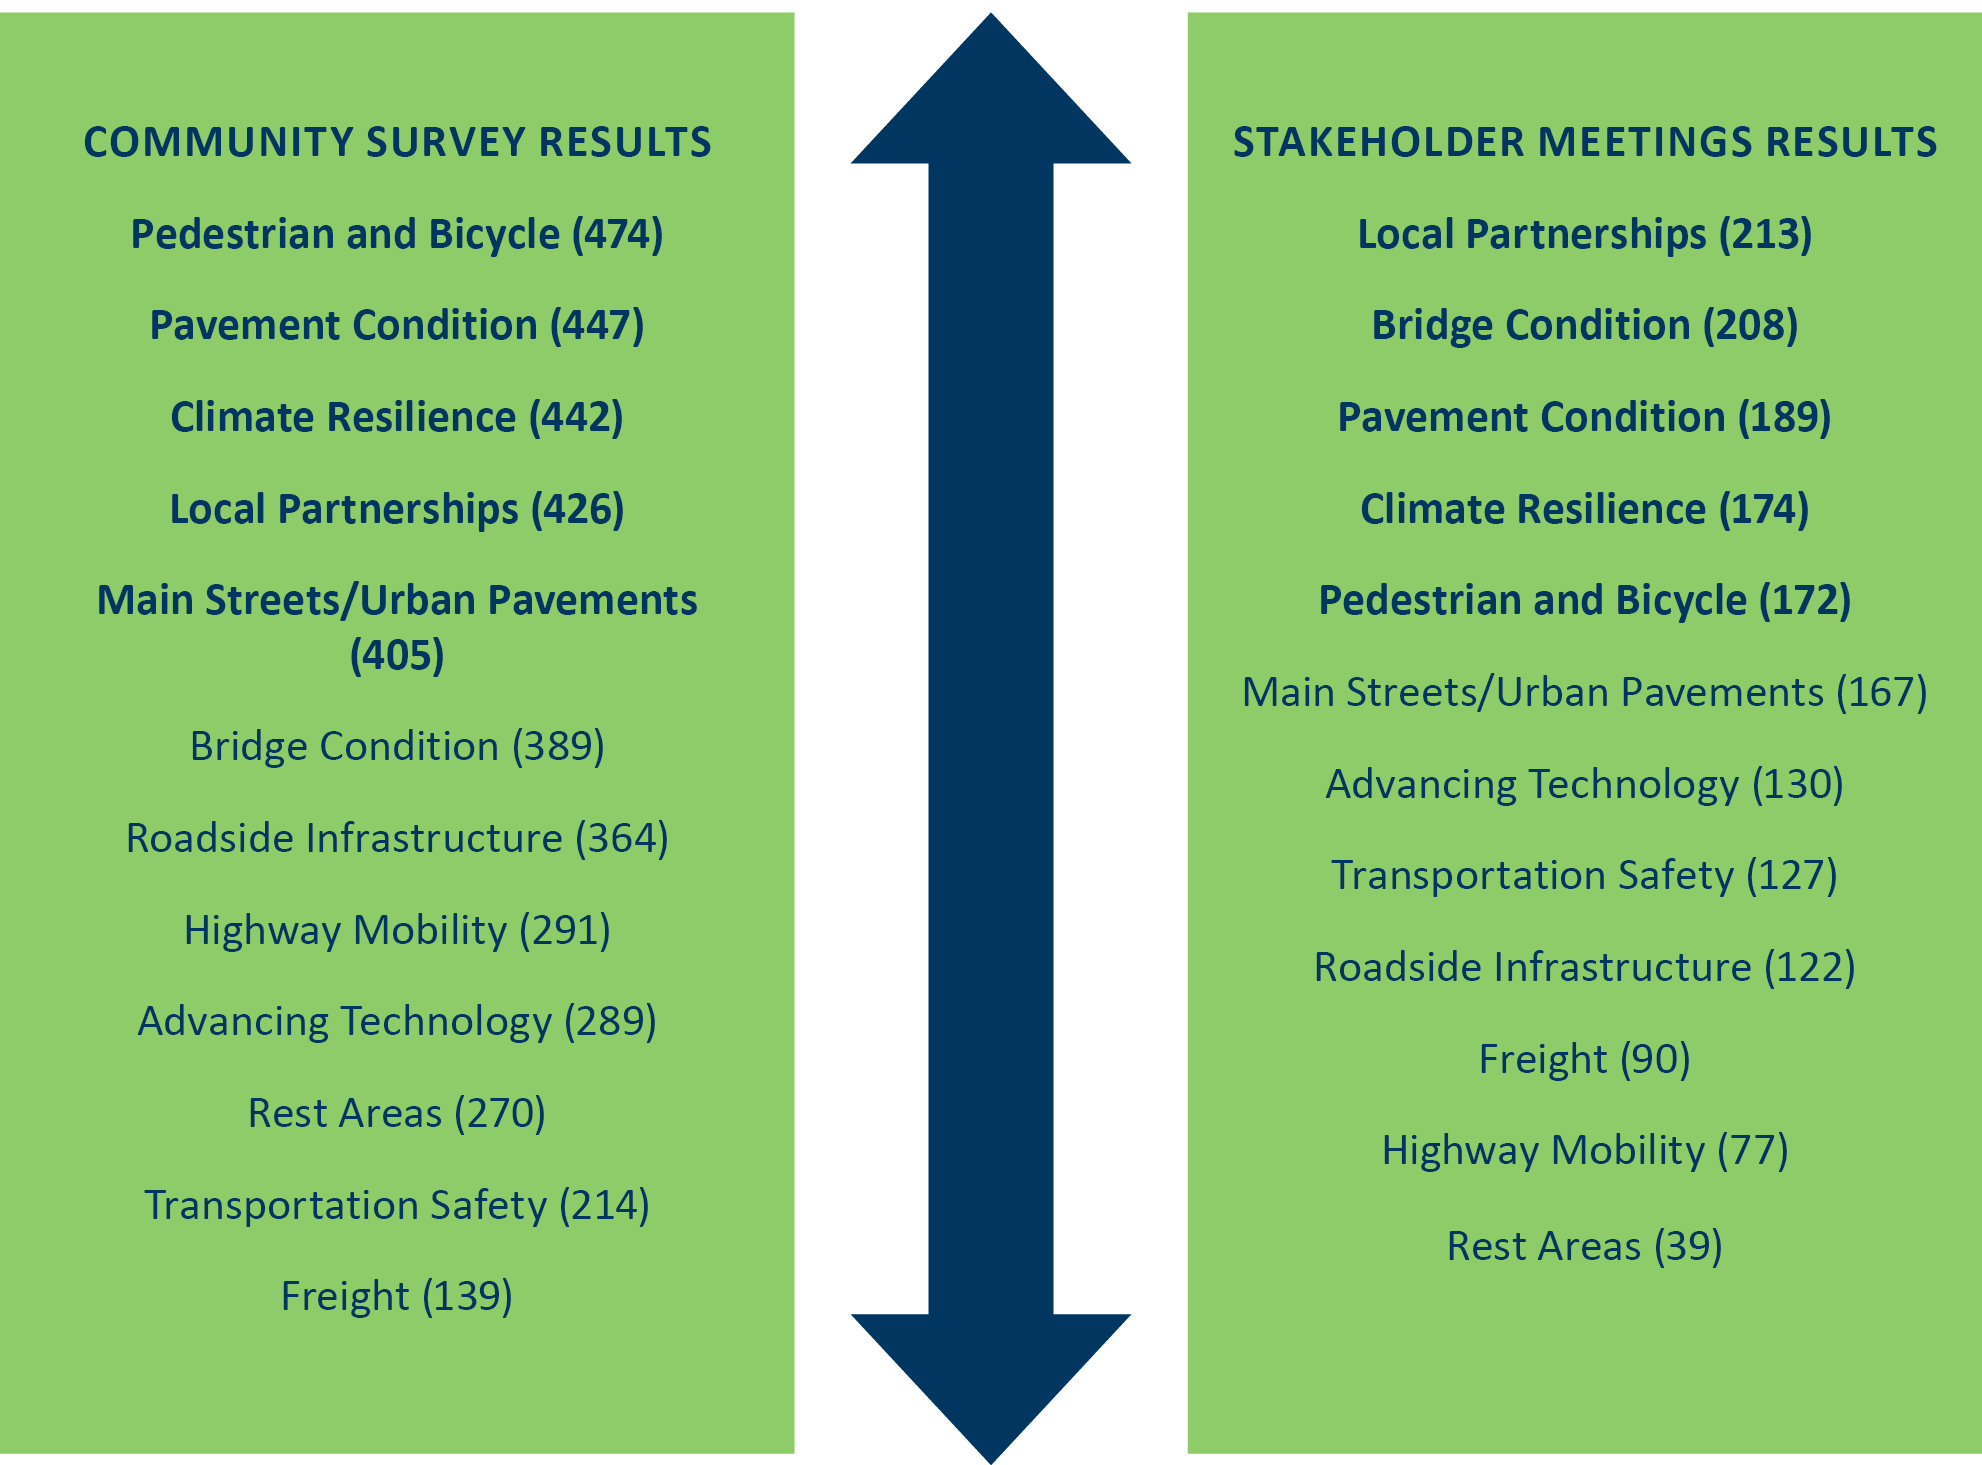
MnDOT distributed the survey to the public and to partner agencies, governments and stakeholders. These two groups expressed similar interests but in different order of priority. Community members were more likely to emphasize pedestrian and bicycle infrastructure, while stakeholders emphasized the importance of local partnerships.
Figure 5-8: Priorities Expressed by Community Members vs. Stakeholders
Open-Ended Comments
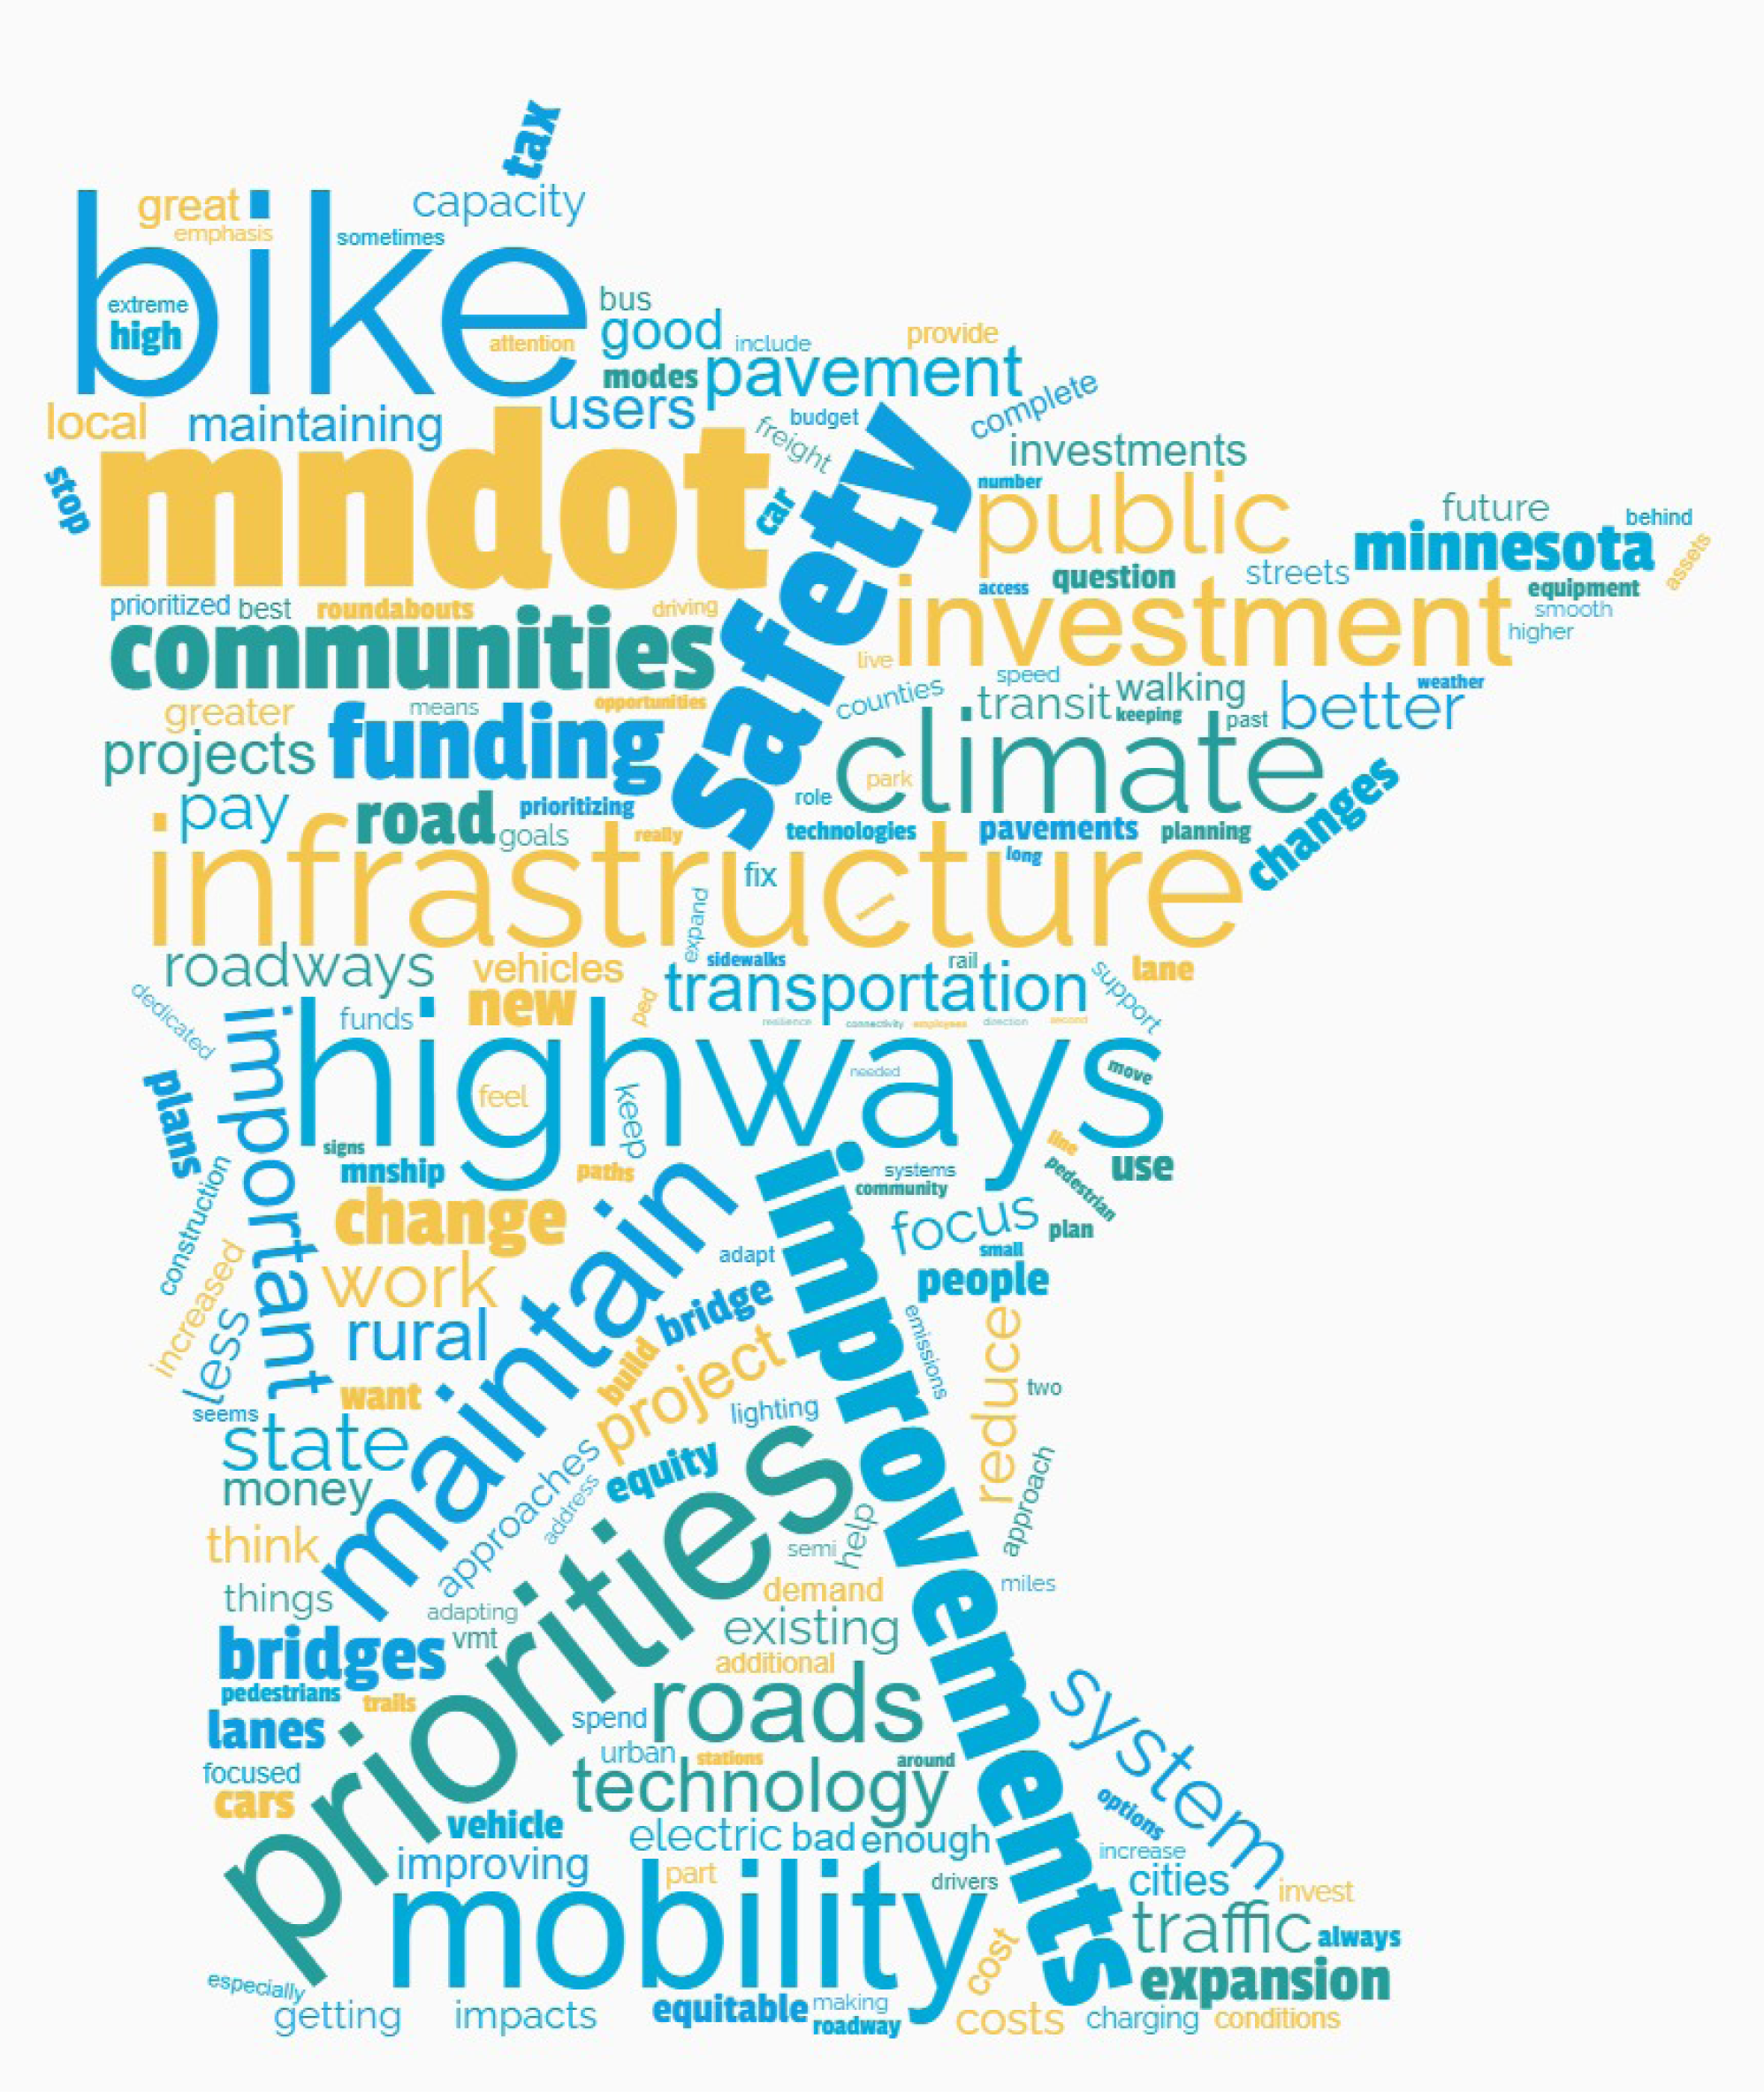
The paper and online surveys provided space for respondents to add open-ended comments. Over 300 of these open-ended responses were received. These responses are summarized in a word cloud below. Survey respondents expressed concern that maintenance of existing infrastructure was falling behind and an interest in improving safety and equity through infrastructure investments.
Figure 5-9: Word Cloud of Common Themes from Open Ended Comments
Input From MnDOT Senior Leadership and Key Agency Staff
Following the public engagement efforts, MnDOT staff provided feedback on the investment approaches and strategies. The top four approaches for MnDOT staff were the same as the public but in a different order of preference (Figure 5-10). Prioritize Pavements/Current approach was a much higher preference for MnDOT staff than the public. Prioritize Pavements/Current Approach and Focus on Safe and Equitable Communities were the top two preferred approaches for MnDOT staff.
Figure 5-10: MnDOT Staff Approach Preference
Setting a Draft 20-Year Investment Direction
MnDOT used the public and stakeholder feedback in Phase I of public engagement as the basis for the development of the draft MnSHIP investment direction. MnDOT staff averaged the results from the in-person and stakeholder surveys as well as the online budget tool. Investment levels were aligned with identified performance levels, where possible. The preliminary draft investment direction was reviewed by the MnSHIP Technical Advisory Committee and Policy Advisory Committee and MnDOT leadership. Figure 5-11 shows the approved draft investment direction for public engagement.
Figure 5-11: Draft Investment Direction for Second Round of Public Engagement
MnDOT developed four themes to communicate the priorities of the draft investment direction. These are:
- Invest to maintain the existing system
- Improve mobility, accessibility and safety for all
- Begin to adapt to a changing future
- Focus on communities and livability
Equity Review
MnDOT reviewed the investment direction-setting process and outcomes through an equity lens and analyzed the Phase I engagement results by demographics. With an Equity Work Group, MnDOT staff discussed who are the beneficiaries of the proposed direction and who is potentially burdened.
In discussing potential burdens and benefits, MnSHIP staff focused on both continuing benefits and burdens as well as who benefits more or is burdened more from the changes resulting from the draft investment direction.
Potential Beneficiaries
- All users of the state highway system are the intended beneficiaries
- Populations that may benefit more from the changes from the previous investment direction:
- People with disabilities
- Tribal communities especially in Greater Minnesota
- Those who don’t drive (either by choice or by circumstance)
- People living near state highways
Potential Burdens
- No significant reversal of past or continuing burdens such as noise/air pollution, size and impact of existing system, and induced demand and traffic to surrounding areas
- Limitations on MnSHIP funding beyond right-of-way to make improvements off system
- Mobility improvements could result in additional right-of-way
- For many, the goal of reaching ADA compliance by 2037 is too long
- Rural low-income populations who rely on driving could see increased burdens and cost caused by deteriorating pavement condition
The Equity Work Group reviewed the MnDOT analysis and generally agreed with the conclusions and did not have objections to the proposed investment direction. The group stressed that equity considerations will be even more important when MnSHIP is applied at the project level. The MnSHIP investment direction guides MnDOT but the real implementation and realization of equitable outcomes happen through project selection and implementation.
Public Outreach on Draft Investment Direction
MnDOT conducted a second round of public outreach in spring 2023. This phase included presentations to stakeholders and an online survey on the draft investment direction. MnDOT ran social media ads to drive traffic to the online survey for responses. The survey asked the following questions:
- How do you feel about the draft investment direction?
- Why do you feel this way? What would you adjust?
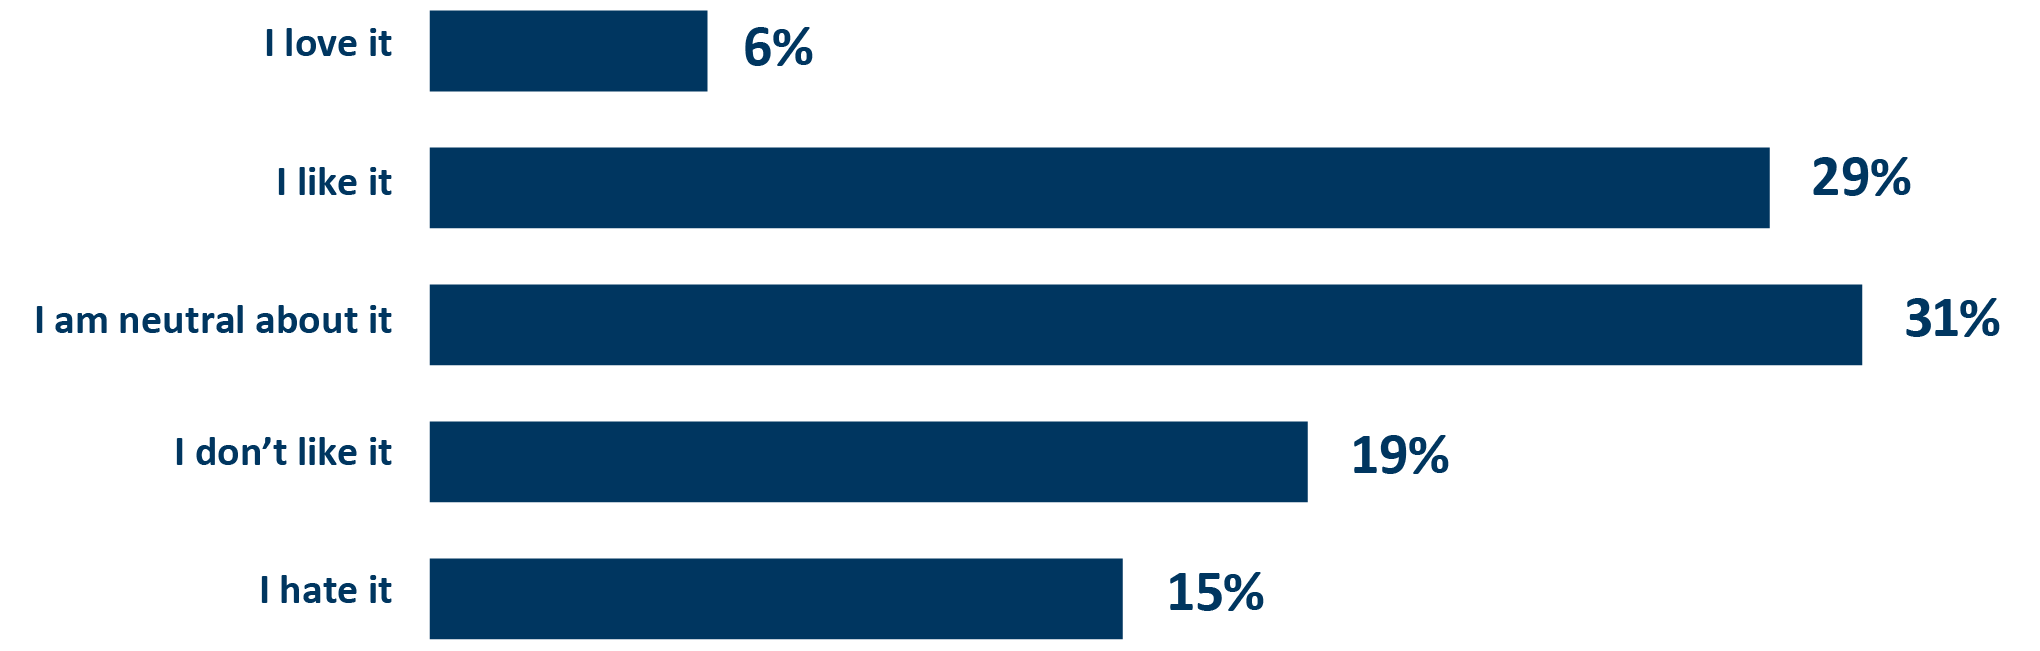
Responses to the draft investment direction were generally neutral or positive. Approximately equal number of people liked the investment direction, were neutral about it and didn’t like it. Figure 5-12 shows the breakdown of responses.
Figure 5-12: Responses to the Draft Investment Direction
Response to the draft investment direction also included open-ended comments about what people would adjust and why. The section below summarizes what people liked or didn’t like about the draft investment direction.
What Is Positive About the Draft Plan?
- Focus on pavement and bridge funding
- An increased focus on pedestrian and bicycle infrastructure
People who responded positively to the plan were less likely to mention reasons for their positivity. Those that did, highlighted the importance of pavement and bridge investment.
What Is Negative About the Draft Plan?
- Too much investment in highway mobility and pavement
- Not a transformational plan. Does not do enough to address greenhouse gas emissions and vehicle miles traveled
- Not enough funding for bicycle and pedestrian infrastructure
The top reasons why people didn’t like the draft investment direction was its highway mobility and pavement investment. These responses generally focused on the highway system’s role in Greenhouse Gas emissions and MnDOT’s target for reducing Vehicle Miles Traveled (VMT). Respondents wanted MnDOT to adopt a more transformational plan that removed state highways from the system to help reduce VMT and emissions from transportation.
Pedestrian and bicycle sentiment was split. Some people didn’t like the draft investment direction because it spent too little on pedestrian and bicycle infrastructure. Some people didn’t like the draft investment direction because it spent too much on pedestrian and bicycle infrastructure.
Increased Revenue Priorities
In addition to getting feedback on the draft investment direction, the second round of public engagement also focused on getting feedback for increased revenue priorities. Respondents used the online budgeting tool to prioritize up to $6 billion in additional funding beyond the draft investment direction. They were able to select increased investments for each of the MnSHIP investment categories.
The average additional investment selected by the public was $5.8 billion. The average additional investment amount by category is shown below.
Figure 5-13: Average Increased Revenue Priority Responses
| Investment Category | Public Feedback Increased Revenue | % of Increase |
|---|---|---|
| Pavement Condition | $1.2 B | 20.8% |
| Bridge Condition | $512 M | 8.8% |
| Roadside Infrastructure | $484 M | 8.3% |
| Rest Areas | $21 M | 0.4% |
| Climate Resilience | $265 M | 4.6% |
| Transportation Safety | $446 M | 7.7% |
| Advancing Technology | $37 M | 0.6% |
| Highway Mobility | $741 M | 12.7% |
| Freight | $114 M | 2.0% |
| Pedestrian and Bicycle | $1.1 B | 19.3% |
| Local Partnerships | $394 M | 6.8% |
| Main Streets/Urban Pavements | $472 M | 8.1% |
| Total | $5.8 B | 100% |
The average dollar amount selected by category is only one way to look at the increased revenue data. Another way is how many people opted to invest above the draft investment direction level for each category. The most selected categories for additional revenue were:
- Transportation Safety (74%)
- Pavement Condition (72%)
- Main Streets/Urban Pavements (68%)
- Bridge Condition (68%)
- Pedestrian and Bicycle (63%)
The least selected categories for additional revenue were:
- Rest Areas (34%)
- Advancing Technology (42%)
- Freight (43%)
- Highway Mobility (45%)
- Roadside Infrastructure (48%)
New Revenue
During the 2023 Minnesota Legislative session, MnDOT received additional transportation revenue beyond the amount anticipated in the baseline revenue scenario. The bill was finalized after the second round of public outreach was completed. With the new revenue, MnDOT projects it will have $36.7 billion over the next 20 years for MnSHIP, $5.2 billion more than the draft investment direction level.
Draft Investment Direction Adjustments
MnDOT needed to make changes from the draft investment direction to plan for the increase in revenue. MnSHIP staff met with the MnSHIP Technical Advisory Committee, Policy Advisory Committee and MnDOT leadership groups to review the public feedback and make recommendations for changes to the draft investment direction. MnDOT used the input on the draft investment direction and the increased revenue priorities to prioritize which investment categories to increase and to what degree.
Figure 5-14: Adjustments to Draft Investment Direction
| Investment Category | Public Feedback Increased Revenue | % of Increase |
|---|---|---|
| Pavement Condition | $1.8 B | 34.3% |
| Bridge Condition | $1.2 B | 22.7% |
| Roadside Infrastructure | $300 M | 5.9% |
| Rest Areas | $0 M | 0.0% |
| Climate Resilience | $100 M | 1.5% |
| Transportation Safety | $250 M | 5.1% |
| Advancing Technology | $<50 M | 0.3% |
| Highway Mobility | $50 M | 1.1% |
| Freight | $100 M | 1.6% |
| Pedestrian and Bicycle | $-100 M* | -1.6% |
| Local Partnerships | $0 M | 0.0% |
| Main Streets/Urban Pavements | $450 M | 7.8% |
| Project Delivery | $1 B | 20.0% |
| Small Programs | $0 M | 0.0% |
| Total | $5.2 B | 100% |
* The total investment in Pedestrian and Bicycle is lower than the draft investment direction. This is due to a revised cost estimate for pedestrian bridges. That change resulted in a reduction of $168 million. The outcomes for Pedestrian and Bicycle are expected to be the same or better than the draft investment direction even with the lower investment amount.
Based on input from the public and transportation stakeholders and MnDOT’s own internal priorities, MnDOT prioritized spending additional funding on:
- Maintaining and repairing existing assets on the state highway system
- Reconstructing Main Streets
- Improving safety
This increased investment would allow MnDOT to limit the number of bridges and miles of pavement in poor condition, especially on the non-NHS. MnDOT is also able to address many more urban reconstruction, or Main Street, projects. These projects allow local governments to improve amenities and facilities along the state highway. The increased safety investment will address more locations with high fatal and serious injury crash rates and provide safety improvements for pedestrians and bicyclists. Smaller increases for Freight and Climate Resilience allow for construction of expanded truck parking at MnDOT owned locations and more locations addressed with climate resilience infrastructure improvements. Additional investments in pedestrian and bicycle infrastructure are focused on improving compliance with the ADA and expanding the bike system on state highways.